Montgomery: Fire Incidents, Minnesota (MN)
Where are fire incidents reported in Montgomery, MN
Something went wrong! Please refresh the page.
|
| |||||||||||||||||||||||||||||||||||||||||||||||||||||||||||||||||||||||||||||||||||||||||||||||||||||||||||||
| Other | 4 | |||||||||||||||||||||||||||||||||||||||||||||||||||||||||||||||||||||||||||||||||||||||||||||||||||||||||||||
2006 - 2018 National Fire Incident Reporting System (NFIRS) incidents
- Incident types reported to NFIRS in Montgomery, MN
- 17046.1%Fire
- 12533.9%Rescue & EMS
- 359.5%Hazardous Condition
- 174.6%Good Intent Call
- 113.0%False Alarm
- 71.9%Severe Weather
- 30.8%Service Call
- 10.3%Special Incident
- Fire incident types reported to NFIRS in Montgomery, MN
- 6538.2%Structure Fires
- 5733.5%Outside Fires
- 2514.7%Mobile Property/Vehicle Fires
- 2313.5%Other
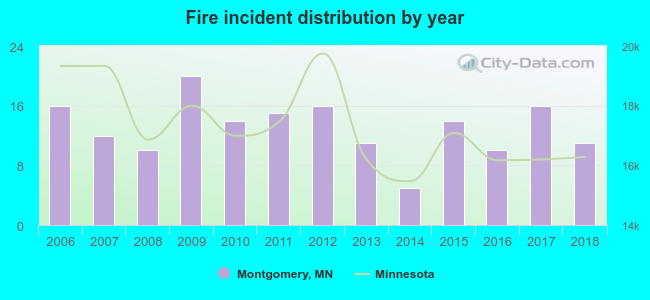 Based on the data from the years 2006 - 2018 the average number of fire incidents per year is 13. The highest number of fire incidents - 20 took place in 2009, and the least - 5 in 2014. The data has a declining trend.
 33.5% incidents where reported in the morning and 66.5% in the evening. The most fires (20.0%) took place on Thursday, and the least (8.8%) on Wednesday.
 According to the 170 fires from years 2006 - 2018 most fires (14.1%) took place during October, and the least (4.7%) in December.
 Out of all 369 cases reported during the years 2006 - 2018, the most belonged to the categories: Fire (46.1%), Overpressure Rupture (33.9%), and Rescue & EMS (9.5%).
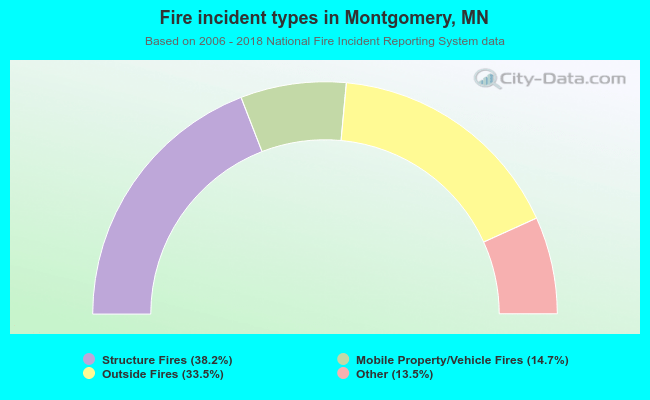 When looking into fire subcategories, the most reports belonged to: Structure Fires (38.2%), and Outside Fires (33.5%).