| Fire incidents reported |
|---|
| Sreet name | Count |
|---|
| HWY 169 | 28 | | OLD MOORINGSPORT RD | 18 | | LATIMER ST | 14 | | STATE LINE RD | 12 | | BLANCHARDLATEX RD | 8 | | FRANCIS AV | 8 | | MOORINGSPORTLATEX RD | 8 | | BLANCHARD-LATEX RD | 6 | | BLANCHARDFURRH RD | 6 | | CADDO LAKE RD | 6 | | FRANCIS AV | 6 | | HWY 1 | 6 | | LAKE ST | 6 | | N HWY 169 | 6 | | PINECREST RD | 6 | | WESTON ST | 6 | | AGURS ST | 4 | | BLANCHARD-FURRH RD | 4 | | BLANCHARD-FURRH RD | 4 | | BLANCHARDLATEX RD | 4 | | CADDO LEASE RD | 4 | | CIRCLE SQUARE DR | 4 | | CROUCH DAM RD | 4 | | HIGGINS ST | 4 | | HOWARD ST | 4 |
| | | Fire incidents reported |
|---|
| Sreet name | Count |
|---|
| HWY 538 | 4 | | IVY ST | 4 | | LAKEVIEW ST | 4 | | LINDSAY RD | 4 | | MOORING ST | 4 | | MOORINGSPORT-LATEX RD | 4 | | OLD MOORINGSPORT LATEX RD | 4 | | STATE LINE RD | 4 | | TEALGLEN DR | 4 | | 8372 HAPHAZARD RD | 2 | | ALLEN ST | 2 | | BLANCHARD FURRH RD | 2 | | BLANCHARD LA-TEX RD | 2 | | BLANCHARD-LATEX RD | 2 | | BOY SCOUT CAMP RD | 2 | | BROWN ST | 2 | | CROUCH DAM RD | 2 | | DAYTON RD | 2 | | DILLY RD | 2 | | GREENWOOD ST | 2 | | GREENWOODMOORINGSPORT RD | 2 | | HAPHAZARD RD | 2 | | HAPHAZZARD RD | 2 | | HEREFORD RD | 2 | | J J | 2 |
|
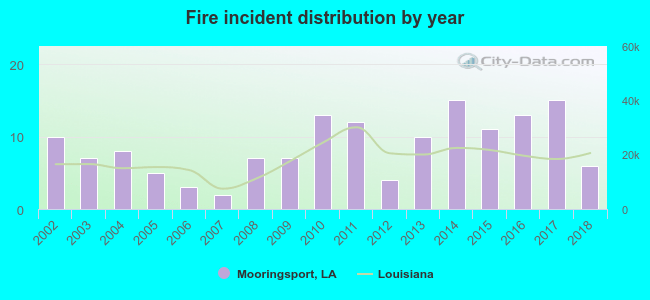 Based on the data from the years 2002 - 2018 the average number of fires per year is 9. The highest number of reported fires - 15 took place in 2014, and the least - 2 in 2007. The data has a decreasing trend.
 24.3% incidents where reported in the morning and 75.7% in the evening. The most fires (19.6%) took place on Saturday, and the least (10.8%) on Friday.
 Based on the 148 fire incident reports from years 2002 - 2018 most fires (15.5%) took place during August, and the least (1.4%) in June.
 Out of all 846 cases reported during the years 2002 - 2018, the most belonged to the categories: Rescue & EMS (55.8%), Fire (17.5%), and Good Intent Call (10.5%).
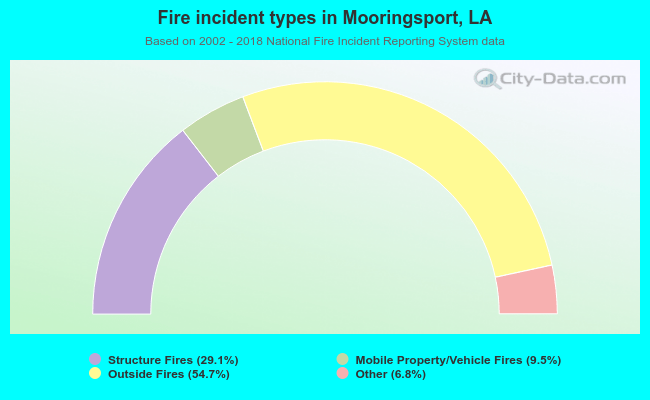 When looking into fire subcategories, the most reports belonged to: Outside Fires (54.7%), and Structure Fires (29.1%).