Moreno Valley: Fire Incidents, California (CA)
Where are fire incidents reported in Moreno Valley, CA
Something went wrong! Please refresh the page.
|
| |||||||||||||||||||||||||||||||||||||||||||||||||||||||||||||||||||||||||||||||||||||||||||||||||||||||||||||
2005 - 2018 National Fire Incident Reporting System (NFIRS) incidents
- Incident types reported to NFIRS in Moreno Valley, CA
- 16546.6%Rescue & EMS
- 13638.4%Fire
- 174.8%Good Intent Call
- 133.7%Hazardous Condition
- 133.7%False Alarm
- 82.3%Service Call
- 20.6%Special Incident
- Fire incident types reported to NFIRS in Moreno Valley, CA
- 7857.4%Outside Fires
- 3122.8%Mobile Property/Vehicle Fires
- 2014.7%Structure Fires
- 75.1%Other
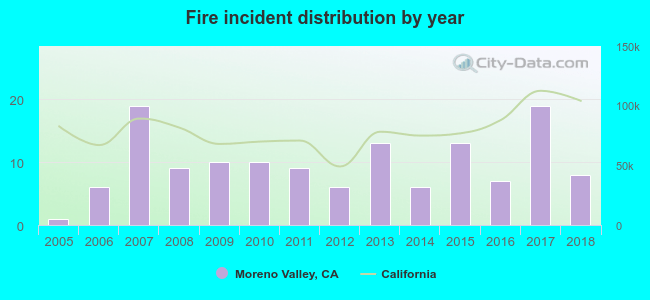 According to the data from the years 2005 - 2018 the average number of fires per year is 10. The highest number of fire incidents - 19 took place in 2007, and the least - 1 in 2005. The data has a rising trend.
The average number of yearly fire incidents per 10k residents in Moreno Valley, CA compared to nearest cities:
(Note: Based on data for the last 3 years, including only cities with population 5,000 and above)
| Moreno Valley: | 0.6 |
| Mead Valley: | 0.5 |
| Woodcrest: | 1.0 |
| Loma Linda: | 30.9 |
| Grand Terrace: | 8.3 |
| Perris: | 1.7 |
| Redlands: | 34.5 |
| Riverside: | 29.1 |
| Nuevo: | 3.9 |

 27.9% incidents where reported in the morning and 72.1% in the evening. The most fires (17.6%) took place on Saturday, and the least (9.6%) on Monday.
 Based on the 136 fire incidents from years 2005 - 2018 most fires (16.2%) took place during August, and the least (2.9%) in February.
 Out of all 354 cases reported during the years 2005 - 2018, the most belonged to the categories: Overpressure Rupture (46.6%), Fire (38.4%), and Service Call (4.8%).
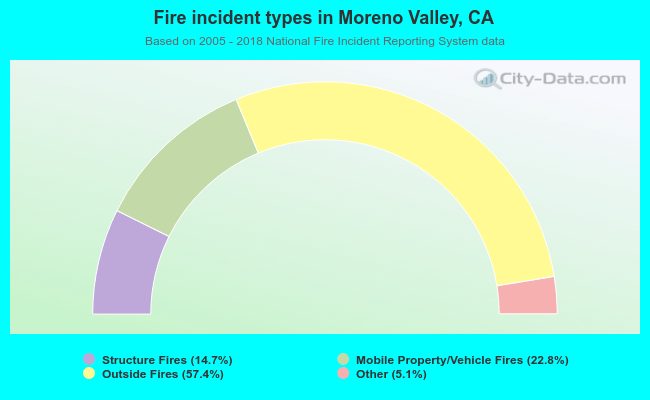 When looking into fire subcategories, the most incidents belonged to: Outside Fires (57.4%), and Mobile Property/Vehicle Fires (22.8%).