Morristown: Fire Incidents, Indiana (IN)
Where are fire incidents reported in Morristown, IN
Something went wrong! Please refresh the page.
|
| |||||||||||||||||||||||||||||||||||||||||||||||||||||||||||||||||||||||||||||||||||||||||||||||||||||||||||||
2002 - 2018 National Fire Incident Reporting System (NFIRS) incidents
- Incident types reported to NFIRS in Morristown, IN
- 97462.9%Rescue & EMS
- 25716.6%Fire
- 19112.3%Good Intent Call
- 634.1%Hazardous Condition
- 392.5%Service Call
- 221.4%False Alarm
- 20.1%Overpressure Rupture
- Fire incident types reported to NFIRS in Morristown, IN
- 11845.9%Structure Fires
- 10038.9%Outside Fires
- 2810.9%Mobile Property/Vehicle Fires
- 114.3%Other
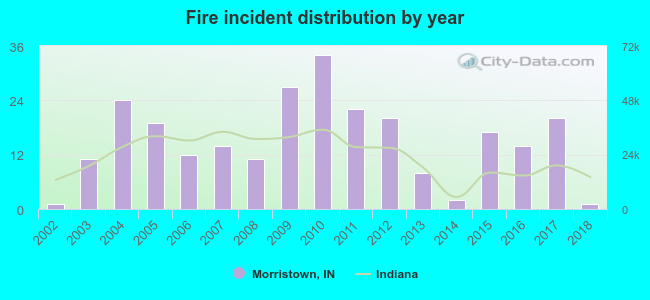 Based on the data from the years 2002 - 2018 the average number of fire incidents per year is 15. The highest number of fires - 34 took place in 2010, and the least - 1 in 2002. The data has a constant trend.
 21.0% incidents where reported in the morning and 79.0% in the evening. The most fires (23.7%) took place on Saturday, and the least (10.1%) on Monday.
 According to the 257 incident reports from years 2002 - 2018 most fires (18.3%) took place during October, and the least (3.5%) in August.
 Out of all 1,549 cases reported during the years 2002 - 2018, the most belonged to the categories: Rescue & EMS (62.9%), Fire (16.6%), and Good Intent Call (12.3%).
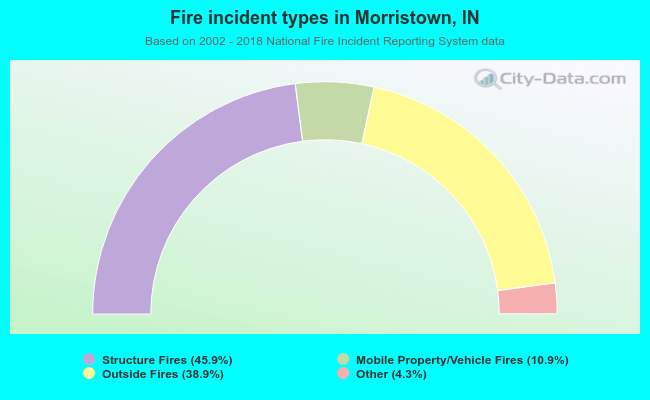 When looking into fire subcategories, the most reports belonged to: Structure Fires (45.9%), and Outside Fires (38.9%).