| Fire incidents reported |
|---|
| Sreet name | Count |
|---|
| ROUTE 20 | 10 | | FEARON ROAD | 6 | | HART ROAD | 6 | | PRATTS RD | 6 | | 4228 BROOKS ROAD | 4 | | 5000 RESEVOIR ROAD | 4 | | 5107 ROUTE 20 WEST | 4 | | 55 EAST MAIN STREET | 4 | | 5505 CHRISTIAN HILL ROAD | 4 | | CHRISTIAN HILL RD | 4 | | DAVIS CORNERS RD | 4 | | EATON ROAD | 4 | | ENGLISH AVE | 4 | | ROUTE 20 WEST | 4 | | ROUTE 46 | 4 | | SOUTH STREET | 4 | | WHITE PINES TRAILER PARK | 4 | | 10 WEST MAIN STREET | 2 | | 100 EATON STREET | 2 | | 101 SOUTH STREET | 2 | | 113 EAST MAIN STREET | 2 | | 12 UNION STREET | 2 | | 126 EAST MAIN STREET | 2 | | 128 EAST MAIN STREET | 2 | | 14 NORTH STREET | 2 |
| | | Fire incidents reported |
|---|
| Sreet name | Count |
|---|
| 15 NORTH STREET | 2 | | 15 WEST MAIN STREET | 2 | | 16 CEDAR STREET | 2 | | 16 WEST MAIN STREET | 2 | | 19 SOUTH STREET | 2 | | 23 EAST MAIN STREET | 2 | | 2445 FEARON ROAD | 2 | | 25 EAST MAIN STREET | 2 | | 26 RADNOR LAN | 2 | | 2617 LEBANON HILL ROAD | 2 | | 2672 ELM STREET | 2 | | 2842 ROUTE 46 | 2 | | 3 EAST MAIN | 2 | | 3 EAST MAIN STREET | 2 | | 31 SOUTH STREET | 2 | | 3123 SANFORD ROAD | 2 | | 3210 SANFORD ROAD | 2 | | 3274 MCQUEEN ROAD | 2 | | 3331 SANFORD ROAD | 2 | | 3446 WILLIAMS CORNERS ROAD | 2 | | 3479 HUGHES ROAD | 2 | | 3487 EATON ROAD | 2 | | 3516 PRATTS ROAD | 2 | | 3516 WEST LAKE ROAD | 2 | | 3555 EATON ROAD | 2 |
|
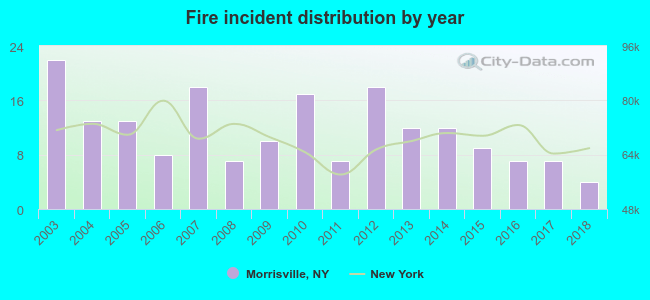 Based on the data from the years 2003 - 2018 the average number of fire incidents per year is 12. The highest number of reported fires - 22 took place in 2003, and the least - 4 in 2018. The data has a declining trend.
 23.9% incidents where reported in the morning and 76.1% in the evening. The most fires (17.9%) took place on Thursday, and the least (9.2%) on Wednesday.
 Based on the 184 fire incidents from years 2003 - 2018 most fires (14.7%) took place during April, and the least (4.9%) in August.
 Out of all 2,167 cases reported during the years 2003 - 2018, the most belonged to the categories: Rescue & EMS (63.1%), False Alarm (13.3%), and Fire (8.5%).
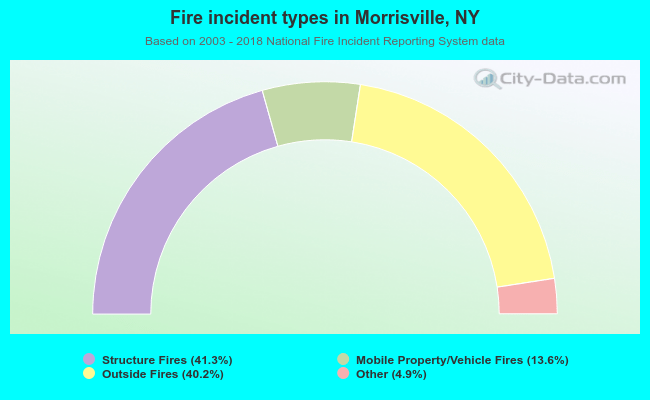 When looking into fire subcategories, the most incidents belonged to: Structure Fires (41.3%), and Outside Fires (40.2%).