| Fire incidents reported |
|---|
| Sreet name | Count |
|---|
| PIKE ST | 82 | | MIRANDA ST | 30 | | WELCH RD | 28 | | MIAMI ST | 20 | | MAIN ST | 18 | | US. RT. 22-3 | 18 | | THOMPSON ST | 16 | | 1ST ST | 14 | | MIDDLEBORO RD | 14 | | SHAWHAN RD | 14 | | WESTVIEW DR | 14 | | HIGHLAWN AVE | 12 | | MORROW ROSSBURG RD | 12 | | OVERLOOK DR | 12 | | FLORA DR | 10 | | SALEM RD | 10 | | VIRGINIA ST | 10 | | GRANT ST | 8 | | HOPKINS ST | 8 | | MORROW WOODVILLE RD | 8 | | MORROW-BLACKHAWK RD | 8 | | US RT 22 | 8 | | WAYNESVILLE RD | 8 | | 2ND ST | 6 | | ANNE MARIE DR | 6 |
| | | Fire incidents reported |
|---|
| Sreet name | Count |
|---|
| LINCOLN ST | 6 | | MORROW-COZADDALE RD | 6 | | MORROWBLACKHAWK RD | 6 | | OSCEOLA | 6 | | PAMELA DR | 6 | | ZOAR RD | 6 | | BURTON AVE | 4 | | DALLASBURG RD | 4 | | FRONT ST | 4 | | IRELAND RD | 4 | | MASON MORROW MILLGROVE RD | 4 | | MORROW COZADDALE | 4 | | MORROW ROSSBURG | 4 | | PROSPECT AVE | 4 | | RED FOX TRAIL | 4 | | RED FOX TRL | 4 | | ROACHESTER OSCEOLA RD | 4 | | SECOND ST | 4 | | ST. RT. 132 | 4 | | STROUT RD | 4 | | SULLIVANS RIDGE DR | 4 | | U.S. ROUTE 22 & 3 | 4 | | US 22 & 3 | 4 | | 100 PAMELA DR | 2 | | |
|
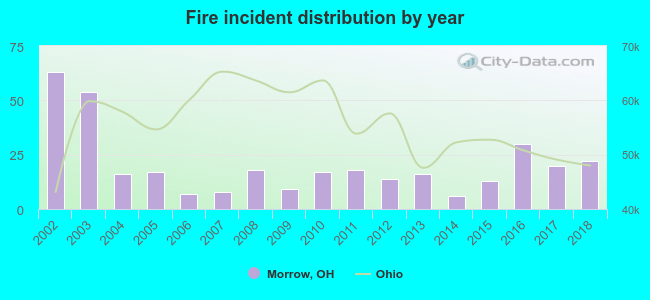 Based on the data from the years 2002 - 2018 the average number of fires per year is 20. The highest number of reported fire incidents - 63 took place in 2002, and the least - 6 in 2014. The data has a decreasing trend.
 30.7% incidents where reported in the morning and 69.3% in the evening. The most fires (17.0%) took place on Saturday, and the least (9.5%) on Wednesday.
 According to the 348 incident reports from years 2002 - 2018 most fires (10.3%) took place during April, and the least (5.5%) in September.
 Out of all 2,570 cases reported during the years 2002 - 2018, the most belonged to the categories: Rescue & EMS (51.9%), Hazardous Condition (17.2%), and Fire (13.5%).
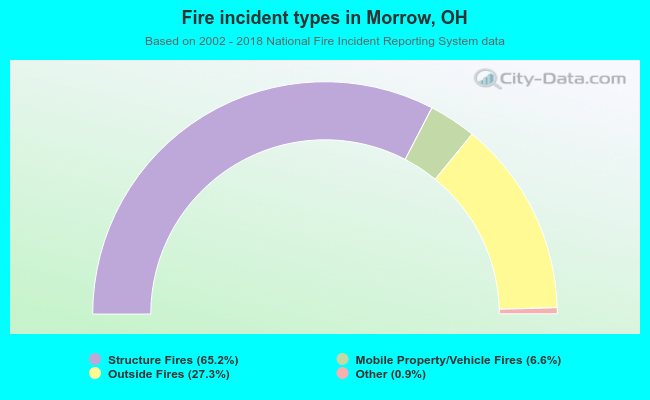 When looking into fire subcategories, the most reports belonged to: Structure Fires (65.2%), and Outside Fires (27.3%).