| Fire incidents reported |
|---|
| Sreet name | Count |
|---|
| MOSSYROCK RD | 34 | | GREEN MOUNTAIN RD | 16 | | YOUNG RD | 14 | | ISBELL RD | 12 | | STATE ST | 12 | | FLYNN RD | 10 | | GREEN MT RD | 10 | | PERKINS RD | 10 | | VALLEY VIEW DR | 10 | | LARSON RD | 8 | | WILSON RD | 8 | | AJLUNE RD | 6 | | ALDRICH RD | 6 | | BLANKENSHIP RD | 6 | | GODFREY RD | 6 | | JARVIS RD | 6 | | LAUREL ST | 6 | | MAIN ST | 6 | | OSBORNE RD | 6 | | STATE RT 122 | 6 | | SWOFFORD RD | 6 | | WORKMAN RD | 6 | | BOYD RD | 4 | | COURT ST | 4 | | CRAIG LN | 4 |
| | | Fire incidents reported |
|---|
| Sreet name | Count |
|---|
| DAMROND RD | 4 | | DEER RIDGE LN | 4 | | MOSSYROCK AVE | 4 | | MOSSYROCK RD WEST | 4 | | MUT3 | 4 | | SKYVIEW DR | 4 | | SWIGERT RD | 4 | | US HIGHWAY 12 | 4 | | WINSTON CREEK RD | 4 | | 100 BLOCK OF HAFER RD | 2 | | 12 HWY | 2 | | 126 PERKINS RD | 2 | | 131 STATE RT 122 | 2 | | 137 FISH HACHERY RD | 2 | | 145 BAKER DR. | 2 | | 179 LAKE RD | 2 | | 200 BLOCK JERRELS RD | 2 | | 299-A BLANKENSHIP RD | 2 | | 300 BLOCK MOSSYROCK RD E | 2 | | 309 BIRELY RD | 2 | | 314-A BIRLEY RD | 2 | | 376 JAMES ST | 2 | | 391 E. STATE STREET | 2 | | 4213 US HWY 12 | 2 | | 498 MOSSYROCK RD EAST | 2 |
|
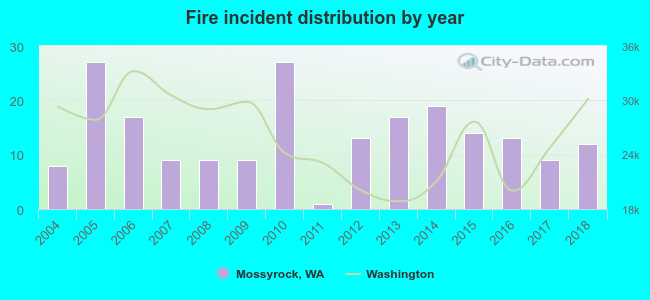 Based on the data from the years 2004 - 2018 the average number of fires per year is 14. The highest number of fire incidents - 27 took place in 2005, and the least - 1 in 2011. The data has an increasing trend.
 28.4% incidents where reported in the morning and 71.6% in the evening. The most fires (22.5%) took place on Saturday, and the least (11.3%) on Friday.
 Based on the 204 fire incident reports from years 2004 - 2018 most fires (9.8%) took place during February, and the least (4.9%) in October.
 Out of all 1,206 cases reported during the years 2004 - 2018, the most belonged to the categories: Overpressure Rupture (69.2%), Fire (16.9%), and Service Call (4.4%).
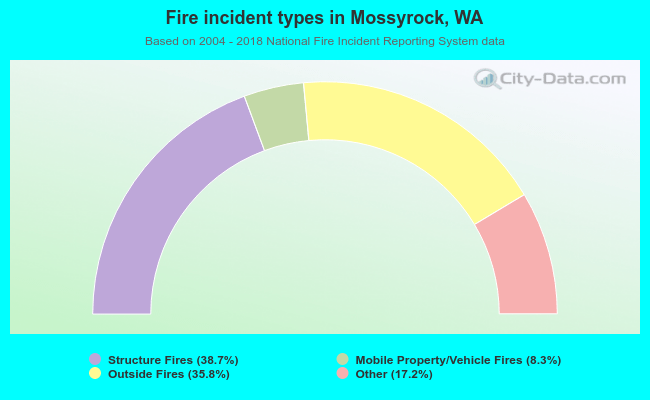 When looking into fire subcategories, the most reports belonged to: Structure Fires (38.7%), and Outside Fires (35.8%).