Mound City: Fire Incidents, Kansas (KS)
Where are fire incidents reported in Mound City, KS
Something went wrong! Please refresh the page.
|
| |||||||||||||||||||||||||||||||||||||||||||||||||||||||||||||||||||||||||||||||||||||||||||||||||||||||||||||
| Other | 7 | |||||||||||||||||||||||||||||||||||||||||||||||||||||||||||||||||||||||||||||||||||||||||||||||||||||||||||||
2005 - 2018 National Fire Incident Reporting System (NFIRS) incidents
- Incident types reported to NFIRS in Mound City, KS
- 40757.2%Fire
- 15521.8%Rescue & EMS
- 709.8%Hazardous Condition
- 375.2%Good Intent Call
- 253.5%Service Call
- 91.3%False Alarm
- 50.7%Special Incident
- 40.6%Severe Weather
- Fire incident types reported to NFIRS in Mound City, KS
- 29472.2%Outside Fires
- 6816.7%Structure Fires
- 317.6%Mobile Property/Vehicle Fires
- 143.4%Other
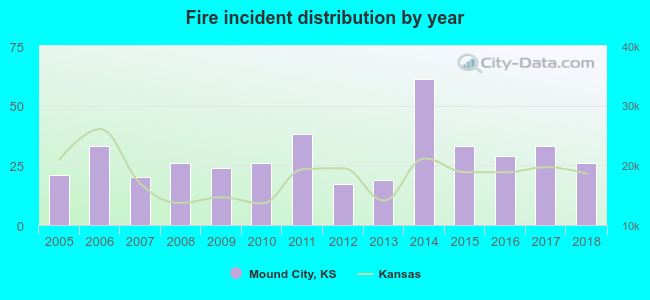 Based on the data from the years 2005 - 2018 the average number of fires per year is 29. The highest number of fire incidents - 61 took place in 2014, and the least - 17 in 2012. The data has an increasing trend.
 20.1% incidents where reported in the morning and 79.9% in the evening. The most fires (20.4%) took place on Saturday, and the least (10.3%) on Monday.
 According to the 407 fire incident reports from years 2005 - 2018 most fires (28.5%) took place during March, and the least (3.2%) in June.
 Out of all 712 cases reported during the years 2005 - 2018, the most belonged to the categories: Fire (57.2%), Overpressure Rupture (21.8%), and Rescue & EMS (9.8%).
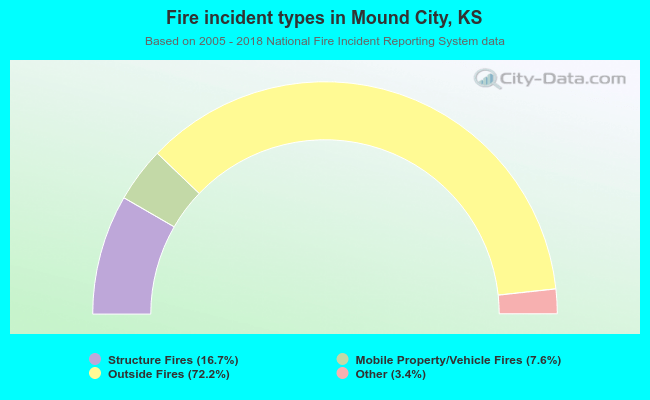 When looking into fire subcategories, the most incidents belonged to: Outside Fires (72.2%), and Structure Fires (16.7%).