Moundsville: Fire Incidents, West Virginia (WV)
Where are fire incidents reported in Moundsville, WV
Something went wrong! Please refresh the page.
| Fire incidents reported | |
|---|---|
| Sreet name | Count |
| LAFAYETTE AVE | 58 |
| 7TH ST | 44 |
| JEFFERSON AVE | 40 |
| 10TH ST | 38 |
| FIRST ST | 30 |
| LAFAYETTE AV | 30 |
| MIDDLE GRAVE CREEK RD | 26 |
| OLIVE AVE | 26 |
| SECOND ST | 26 |
| 1ST ST | 24 |
| CENTER ST | 24 |
| RUBY ST | 24 |
| 12TH ST | 22 |
| 4TH ST | 22 |
| 2ND ST | 20 |
| HIGHLAND AVE | 20 |
| THIRD ST | 20 |
| WASHINGTON AVE | 20 |
| 3RD ST | 18 |
| 8TH ST | 18 |
| ELM AVE | 18 |
| POPLAR AVE | 18 |
| 5TH ST | 16 |
| BIG GRAVE CREEK RD | 16 |
| CEDAR AVE | 16 |
| FIFTH ST | 16 |
| 6TH ST | 14 |
| CAMPBELL HILL RD | 14 |
| DIAMOND ST | 14 |
| DORSEY ST | 14 |
| Other | 606 |
2003 - 2018 National Fire Incident Reporting System (NFIRS) incidents
- Incident types reported to NFIRS in Moundsville, WV
- 2,03026.8%Rescue & EMS
- 1,83624.2%Good Intent Call
- 1,33017.5%Hazardous Condition
- 1,31217.3%Fire
- 6979.2%Service Call
- 3064.0%False Alarm
- 270.4%Severe Weather
- 240.3%Overpressure Rupture
- 170.2%Special Incident
- Fire incident types reported to NFIRS in Moundsville, WV
- 78860.1%Structure Fires
- 32324.6%Outside Fires
- 15511.8%Mobile Property/Vehicle Fires
- 463.5%Other
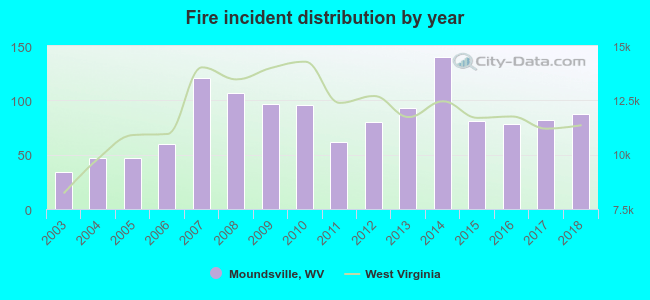 According to the data from the years 2003 - 2018 the average number of fires per year is 82. The highest number of fires - 140 took place in 2014, and the least - 34 in 2003. The data has a growing trend.
The average number of yearly fire incidents per 10k residents in Moundsville, WV compared to nearest cities:
(Note: Based on data for the last 3 years, including only cities with population 5,000 and above)
| Moundsville: | 92.6 |
| Wheeling: | 59.4 |
| New Martinsville: | 60.9 |
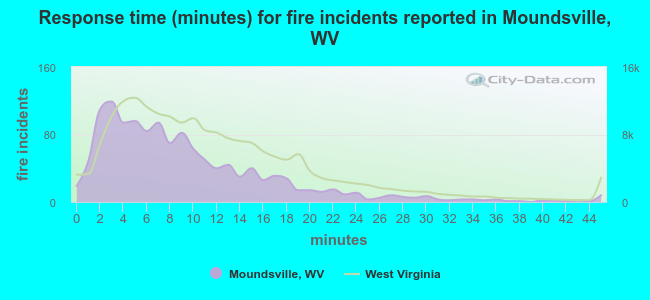 The median response time based on all reported fire incidents is 7 minutes. This is lower than the state median value.
The median response time in Moundsville, WV compared to nearest cities:
(Note: Based on data for all years, including only cities with at least 500 fire incidents)
| Moundsville: | 7 minutes |
| Bellaire: | 7 minutes |
| Bridgeport: | 8 minutes |
| Wheeling: | 4 minutes |
| Martins Ferry: | 7 minutes |
| New Martinsville: | 10 minutes |
| Wellsburg: | 8 minutes |
| Cadiz: | 10 minutes |
| Mingo Junction: | 6 minutes |
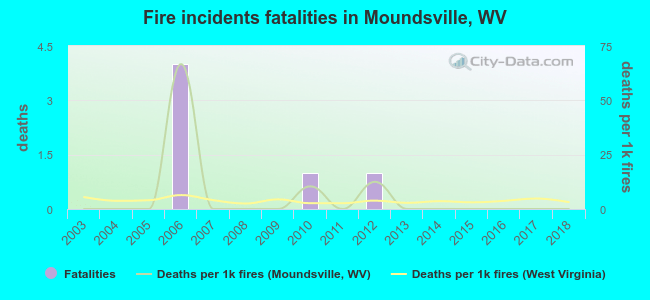 According to the data from the years 2003 - 2018 the average number of fire-related fatalities per year is 0. The highest number of reported deaths - 4 took place in 2006, and the lowest - 0 in 2003. The data has a constant trend.
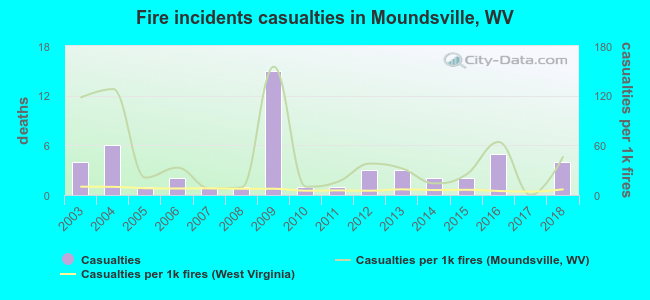 According to the reports from the years 2003 - 2018 the average number of fire-related casualties per year is 3. The highest number of reported casualties - 15 took place in 2009, and the lowest - 0 in 2017. The data has a constant trend.
The average number of injuries per 1,000 fires is 45. This indicator was the highest - 155 in 2009, and the lowest 0 in 2017. The trend for casualties per 1,000 fires is dropping. Compared to the West Virginia value the number of casualties per 1,000 fire incidents is much higher.
According to the reports from the years 2003 - 2018 the average number of fire-related casualties per year is 3. The highest number of reported casualties - 15 took place in 2009, and the lowest - 0 in 2017. The data has a constant trend.
The average number of injuries per 1,000 fires is 45. This indicator was the highest - 155 in 2009, and the lowest 0 in 2017. The trend for casualties per 1,000 fires is dropping. Compared to the West Virginia value the number of casualties per 1,000 fire incidents is much higher.Casualties per 1,000 incidents in Moundsville, WV compared to nearest cities:
(Note: Based on data for all years, including only cities with at least 500 fire incidents)
| Moundsville: | 38.9 |
| Bellaire: | 0.0 |
| Bridgeport: | 9.5 |
| Wheeling: | 4.5 |
| Martins Ferry: | 9.9 |
| New Martinsville: | 17.6 |
| Wellsburg: | 2.4 |
| Cadiz: | 10.6 |
| Mingo Junction: | 40.9 |
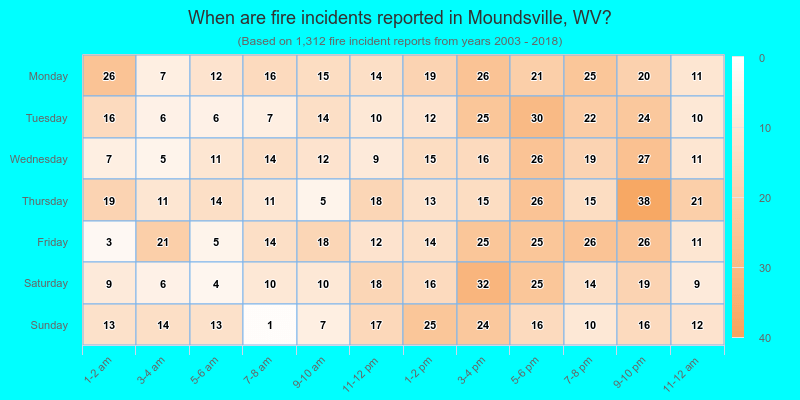
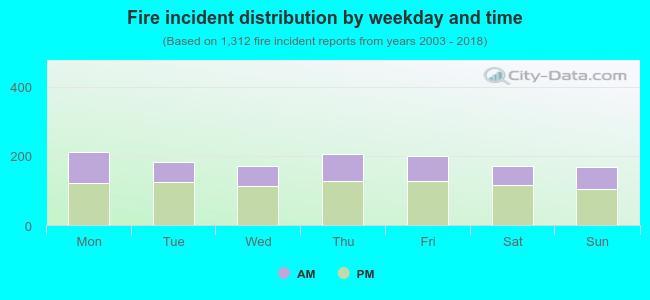 36.6% incidents where reported in the morning and 63.4% in the evening. The most fires (16.2%) took place on Monday, and the least (12.8%) on Sunday.
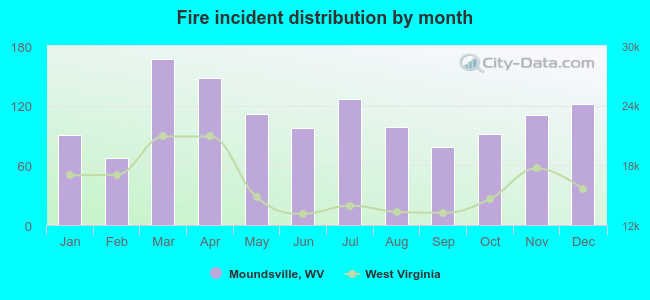 According to the 1,312 fire incidents from years 2003 - 2018 most fires (12.7%) took place during March, and the least (5.1%) in February.
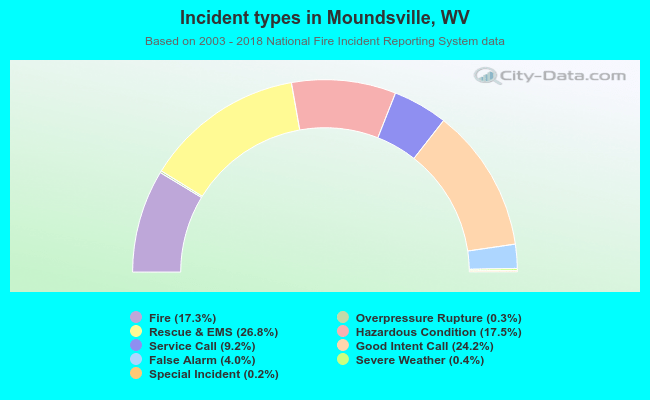 Out of all 7,579 cases reported during the years 2003 - 2018, the most belonged to the categories: Rescue & EMS (26.8%), Good Intent Call (24.2%), and Hazardous Condition (17.5%).
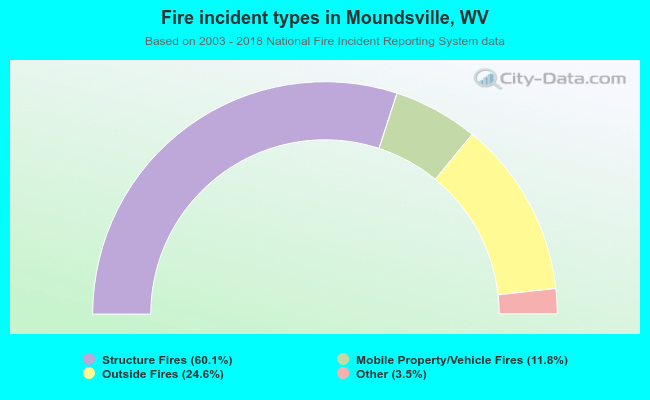 When looking into fire subcategories, the most incidents belonged to: Structure Fires (60.1%), and Outside Fires (24.6%).