| Fire incidents reported |
|---|
| Sreet name | Count |
|---|
| NC 73 HWY | 14 | | PEKIN RD | 14 | | THOMASVILLE CHURCH RD | 10 | | 109 HWY | 8 | | GRASSY ISLAND RD | 8 | | HIGHLAND AVE | 8 | | HIGHWAY 109 | 8 | | HOMANIT USA RD | 8 | | YANK RD | 8 | | ALLENTON ST | 6 | | APPLE ORCHARD RD | 6 | | BOWLES RD | 6 | | HOMINANT USA RD | 6 | | LAKE TILLERY TRL | 6 | | LANDFILL RD | 6 | | LILLYS BRIDGE RD | 6 | | MAIN ST | 6 | | NC 109 HWY | 6 | | NC HWY 109 | 6 | | 4560 NC HWY 2427 WEST | 4 | | CHIP RD | 4 | | DEBERRY RD | 4 | | DOCKERY LN | 4 | | HIGH MEADOW LN | 4 | | HOMMANIT USA RD | 4 |
| | | Fire incidents reported |
|---|
| Sreet name | Count |
|---|
| HWY 73 | 4 | | HYDRO RD | 4 | | LANDLUBBER TRL | 4 | | LIBERTY HILL CHURCH RD | 4 | | MASKE RD | 4 | | MCKAY HILL RD | 4 | | NC HWY 73 | 4 | | PLEASANT GROVES CHURCH RD | 4 | | TEDDAR RD | 4 | | THOMASVILLE CHUECH RD | 4 | | ZION CHURCH RD | 4 | | 100 LIVINGSTON POINT | 2 | | 100 NEWPORT DRIVE | 2 | | 106 FATHOM TRAIL | 2 | | 107 HIDEAWAY TRAIL | 2 | | 1250 RIVER ROAD END | 2 | | 138 PEMBERTON RD | 2 | | 168 DEER PARK ROAD | 2 | | 239 FIDDLER GHOST LANE | 2 | | 2887 LILLYS BRIDGE ROAD | 2 | | 312 PINE BARK CIRCLE | 2 | | 400 WOODRUN DRIVE | 2 | | 4100 SOUTHCREST | 2 | | 455 EMERAL SHORES ROAD | 2 | | 4915 NC HWY 2427 WEST | 2 |
|
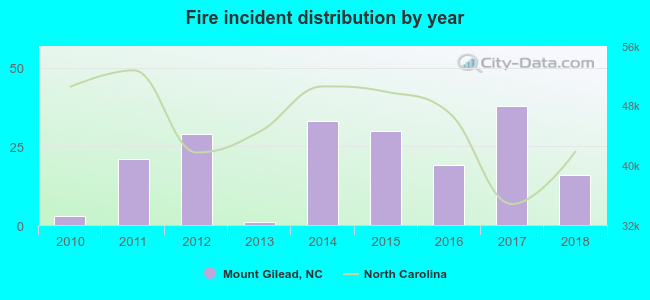 Based on the data from the years 2010 - 2018 the average number of fires per year is 21. The highest number of fires - 38 took place in 2017, and the least - 1 in 2013. The data has a rising trend.
 31.1% incidents where reported in the morning and 68.9% in the evening. The most fires (22.1%) took place on Saturday, and the least (10.0%) on Thursday.
 According to the 190 incident reports from years 2010 - 2018 most fires (16.8%) took place during January, and the least (4.2%) in September.
 Out of all 624 cases reported during the years 2010 - 2018, the most belonged to the categories: Rescue & EMS (31.4%), Fire (30.4%), and Hazardous Condition (14.1%).
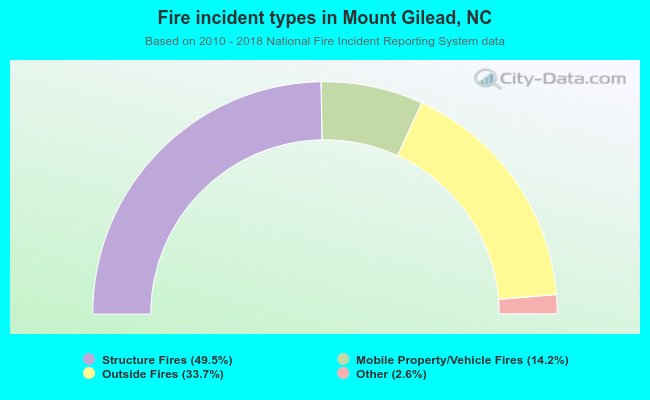 When looking into fire subcategories, the most incidents belonged to: Structure Fires (49.5%), and Outside Fires (33.7%).