| Fire incidents reported |
|---|
| Sreet name | Count |
|---|
| INTERSTATE 71 | 18 | | MAIN ST | 6 | | ST RT 61 | 6 | | STATE ROUTE 19 | 6 | | COUNTY RD. 59 | 4 | | DEERPATH WAY | 4 | | I71 EXPY | 4 | | MARION RD | 4 | | RD 108 | 4 | | RD 109 | 4 | | RD 14 RD | 4 | | RD 20 | 4 | | RD 56 | 4 | | ST RT 95 | 4 | | US RT 42 | 4 | | 29 | 2 | | 30 | 2 | | 3716 COUNTY ROAD 172 | 2 | | 3751 STATE ROUTE 314 | 2 | | 3970 COUNTY ROAD 170 | 2 | | 3991 COUNTY ROAD 172 | 2 | | 4025 COUNTY ROAD 114 | 2 | | 4070 STATE ROUTE 314 | 2 | | 4284 STATE ROUTE 314 | 2 | | 4294 COUNTY ROAD 20 | 2 |
| | | Fire incidents reported |
|---|
| Sreet name | Count |
|---|
| 4691 COUNTY ROAD 123 | 2 | | 4755 STATE ROUTE 314 | 2 | | 4775 COUNTY ROAD 98 | 2 | | 5064 COUNTY ROAD 123 | 2 | | 5087 COUNTY ROAD 92 | 2 | | 5306 COUNTY ROAD 123 | 2 | | 5898 STATE ROUTE 95 | 2 | | 6169 STATE ROUTE 95 | 2 | | 6220 STATE ROUTE 95 | 2 | | 6270 COUNTY ROAD 121 | 2 | | 6276 COUNTY ROAD 87 | 2 | | 6427 STATE ROUTE 95 | 2 | | 6767 STATE ROUTE 95 | 2 | | 6891 COUNTY ROAD 109 | 2 | | 7310 TOWNSHIP ROAD 121 | 2 | | 7393 COUNTY ROAD 14 | 2 | | BRANDYWINE DR | 2 | | CHERRY ST | 2 | | CO. RD. 123 | 2 | | COUNTY RD 20 RD | 2 | | COUNTY RD 30 RD | 2 | | COUNTY RD 59 RD | 2 | | COUNTY RD 81 | 2 | | COUNTY RD 9 RD | 2 | | |
|
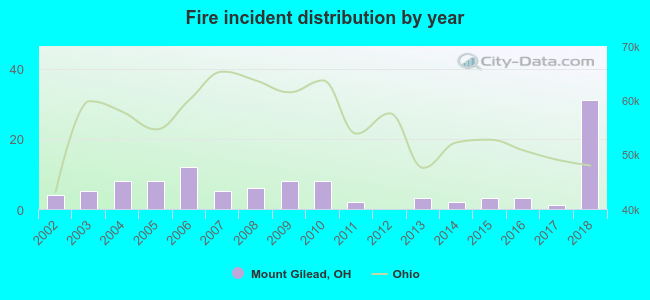 Based on the data from the years 2002 - 2018 the average number of fires per year is 6. The highest number of reported fire incidents - 31 took place in 2018, and the least - 0 in 2012. The data has an increasing trend.
 33.9% incidents where reported in the morning and 66.1% in the evening. The most fires (19.3%) took place on Saturday, and the least (10.1%) on Friday.
 According to the 109 incident reports from years 2002 - 2018 most fires (15.6%) took place during April, and the least (4.6%) in July.
 Out of all 433 cases reported during the years 2002 - 2018, the most belonged to the categories: Rescue & EMS (27.0%), Fire (25.2%), and Hazardous Condition (17.8%).
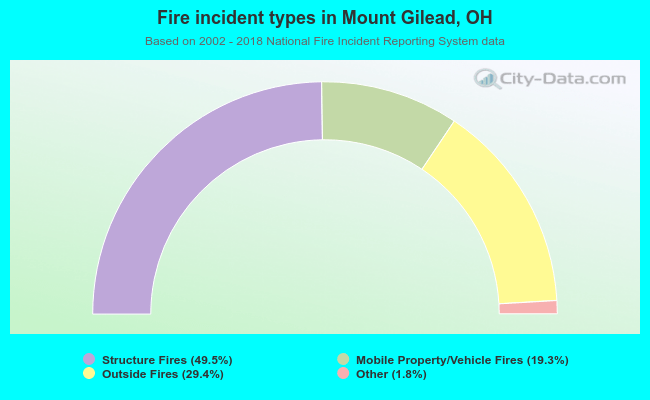 When looking into fire subcategories, the most reports belonged to: Structure Fires (49.5%), and Outside Fires (29.4%).