Mount Pleasant: Fire Incidents, Iowa (IA)
Where are fire incidents reported in Mount Pleasant, IA
Something went wrong! Please refresh the page.
|
| |||||||||||||||||||||||||||||||||||||||||||||||||||||||||||||||||||||||||||||||||||||||||||||||||||||||||||||
| Other | 18 | |||||||||||||||||||||||||||||||||||||||||||||||||||||||||||||||||||||||||||||||||||||||||||||||||||||||||||||
2012 - 2017 National Fire Incident Reporting System (NFIRS) incidents
- Incident types reported to NFIRS in Mount Pleasant, IA
- 23127.4%Rescue & EMS
- 21625.7%Fire
- 15318.2%False Alarm
- 12414.7%Good Intent Call
- 10812.8%Hazardous Condition
- 81.0%Service Call
- 20.2%Special Incident
- Fire incident types reported to NFIRS in Mount Pleasant, IA
- 11553.2%Outside Fires
- 7032.4%Structure Fires
- 2813.0%Mobile Property/Vehicle Fires
- 31.4%Other
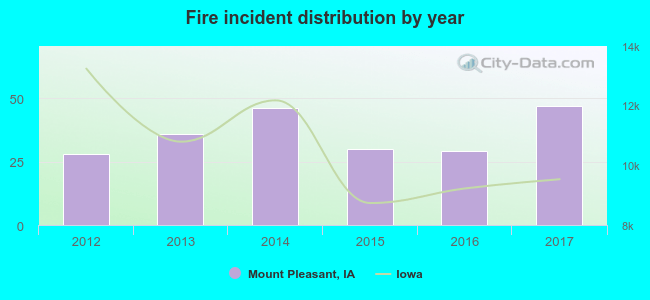 Based on the data from the years 2012 - 2017 the average number of fires per year is 36. The highest number of reported fire incidents - 47 took place in 2017, and the least - 28 in 2012. The data has an increasing trend.
The average number of yearly fire incidents per 10k residents in Mount Pleasant, IA compared to nearest cities:
(Note: Based on data for the last 3 years, including only cities with population 5,000 and above)
| Mount Pleasant: | 43.9 |
| Fairfield: | 43.1 |
| Washington: | 43.5 |
| Burlington: | 38.0 |
| Fort Madison: | 37.6 |
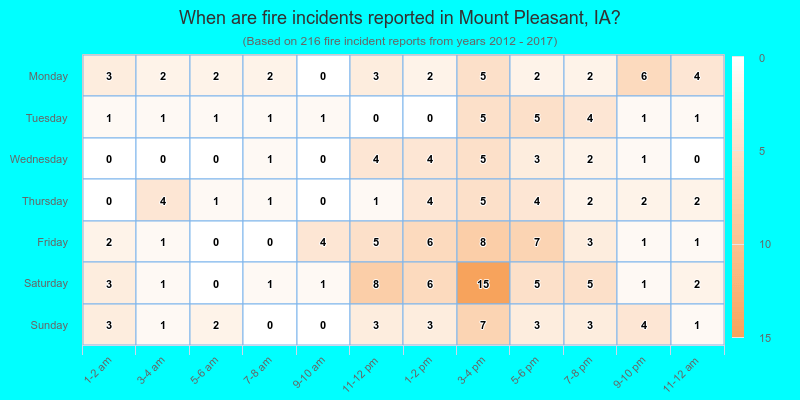
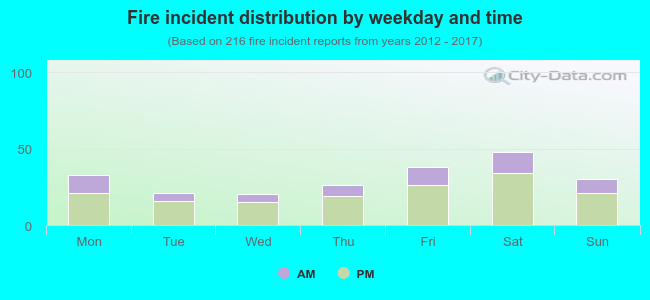 29.6% incidents where reported in the morning and 70.4% in the evening. The most fires (22.2%) took place on Saturday, and the least (9.3%) on Wednesday.
 Based on the 216 reports from years 2012 - 2017 most fires (15.3%) took place during April, and the least (4.6%) in December.
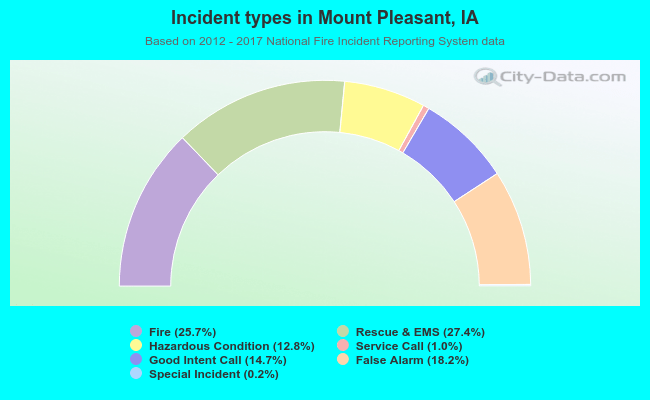 Out of all 842 cases reported during the years 2012 - 2017, the most belonged to the categories: Overpressure Rupture (27.4%), Fire (25.7%), and Good Intent Call (18.2%).
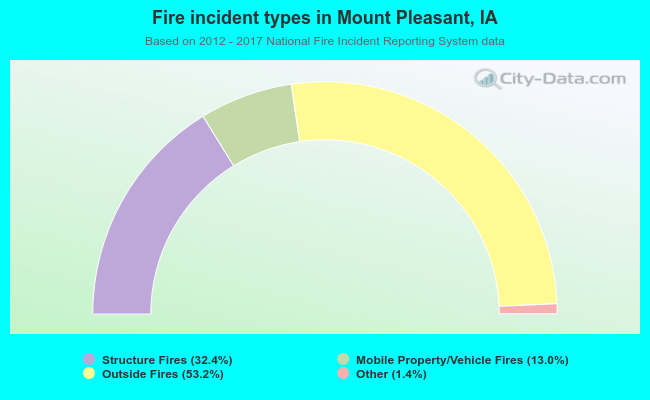 When looking into fire subcategories, the most reports belonged to: Outside Fires (53.2%), and Structure Fires (32.4%).