| Fire incidents reported |
|---|
| Sreet name | Count |
|---|
| MAIN ST | 68 | | SOUTHPORT RD | 26 | | DRY CREEK RD | 24 | | POLK LN | 18 | | NEW LAWRENCEBURG HWY | 16 | | ENTERPRISE RD | 14 | | PRUITT HOLLOW RD | 12 | | WHEELERFIELD RD | 12 | | DOG BRANCH RD | 10 | | GOLF CLUB RD | 10 | | HODGE RD | 10 | | HOWELL RD | 10 | | LAWRENCEBURG HWY | 10 | | TERRAPIN BRANCH RD | 10 | | 43 HWY | 8 | | CROSS BRIDGES RD | 8 | | JOY RD | 8 | | RED ROW RD | 8 | | SMITH HOLLOW RD | 8 | | 166 HWY | 6 | | 43 BYP | 6 | | ARROW LAKE RD | 6 | | ARROW MINES RD | 6 | | BROOKSIDE DR | 6 | | CAMP BRANCH RD | 6 |
| | | Fire incidents reported |
|---|
| Sreet name | Count |
|---|
| CARPENTER ST | 6 | | HAYLONG AVE | 6 | | HOOVER MASON RD | 6 | | JOHNSON HILL RD | 6 | | MCANALLY RD | 6 | | MT JOY RD | 6 | | PREACHER HOLT RD | 6 | | RAILROAD ST | 6 | | SANDY HOOK RD | 6 | | THIRD AVE | 6 | | THOMAS CIR | 6 | | 43 BYPASS | 4 | | ADAMS AVE | 4 | | BROWN WORKMAN LN | 4 | | CANAAN RD | 4 | | COLLEGE ST | 4 | | FIRST AVE | 4 | | GRAY LN | 4 | | HIDDEN ACRES DR | 4 | | HWY 43 | 4 | | JACKSON ST | 4 | | LAKESIDE DR | 4 | | LOCUST ST | 4 | | MASSEY LN | 4 | | OLD 43 HWY | 4 |
|
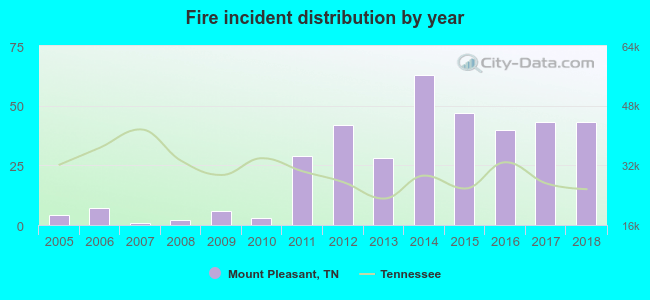 Based on the data from the years 2005 - 2018 the average number of fires per year is 26. The highest number of reported fires - 63 took place in 2014, and the least - 1 in 2007. The data has a growing trend.
 35.5% incidents where reported in the morning and 64.5% in the evening. The most fires (17.6%) took place on Thursday, and the least (11.2%) on Monday.
 According to the 358 fire incidents from years 2005 - 2018 most fires (10.6%) took place during July, and the least (4.7%) in June.
 Out of all 4,351 cases reported during the years 2005 - 2018, the most belonged to the categories: Rescue & EMS (56.9%), Service Call (16.4%), and Good Intent Call (9.4%).
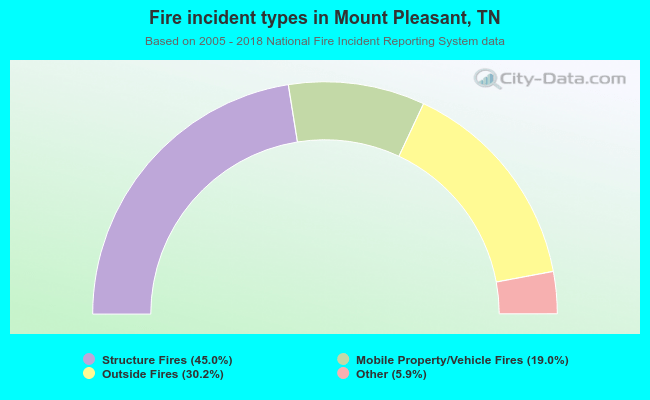 When looking into fire subcategories, the most reports belonged to: Structure Fires (45.0%), and Outside Fires (30.2%).