Mountain Brook: Fire Incidents, Alabama (AL)
Where are fire incidents reported in Mountain Brook, AL
Something went wrong! Please refresh the page.
|
| |||||||||||||||||||||||||||||||||||||||||||||||||||||||||||||||||||||||||||||||||||||||||||||||||||||||||||||
2003 - 2018 National Fire Incident Reporting System (NFIRS) incidents
- Incident types reported to NFIRS in Mountain Brook, AL
- 2,98746.8%Rescue & EMS
- 1,04716.4%Service Call
- 98015.4%False Alarm
- 79112.4%Hazardous Condition
- 4236.6%Fire
- 1262.0%Good Intent Call
- 100.2%Overpressure Rupture
- 80.1%Special Incident
- 70.1%Severe Weather
- Fire incident types reported to NFIRS in Mountain Brook, AL
- 20548.5%Outside Fires
- 16238.3%Structure Fires
- 5312.5%Mobile Property/Vehicle Fires
- 30.7%Other
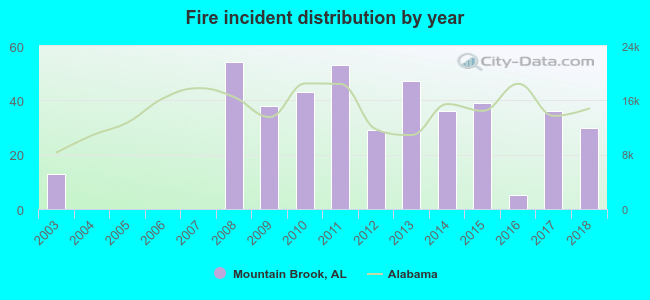 Based on the data from the years 2003 - 2018 the average number of fires per year is 26. The highest number of reported fire incidents - 54 took place in 2008, and the least - 0 in 2004. The data has a growing trend.
The average number of yearly fire incidents per 10k residents in Mountain Brook, AL compared to nearest cities:
(Note: Based on data for the last 3 years, including only cities with population 5,000 and above)
| Mountain Brook: | 11.4 |
| Homewood: | 35.3 |
| Vestavia Hills: | 20.2 |
| Irondale: | 55.7 |
| Birmingham: | 87.0 |
| Tarrant: | 58.6 |
| Hoover: | 8.0 |
| Fultondale: | 48.3 |
| Fairfield: | 8.2 |
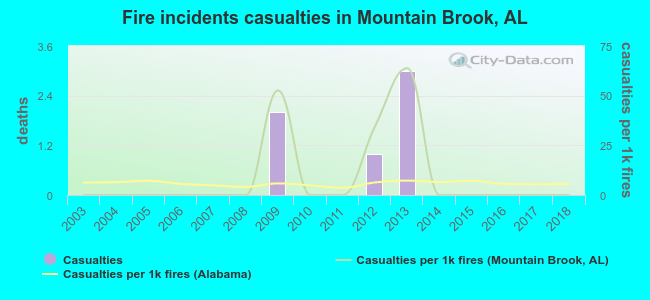 Based on the data from the years 2003 - 2018 the average number of fire-related casualties per year is 0. The highest number of injuries - 3 took place in 2013, and the lowest - 0 in 2003. The data has a constant trend.
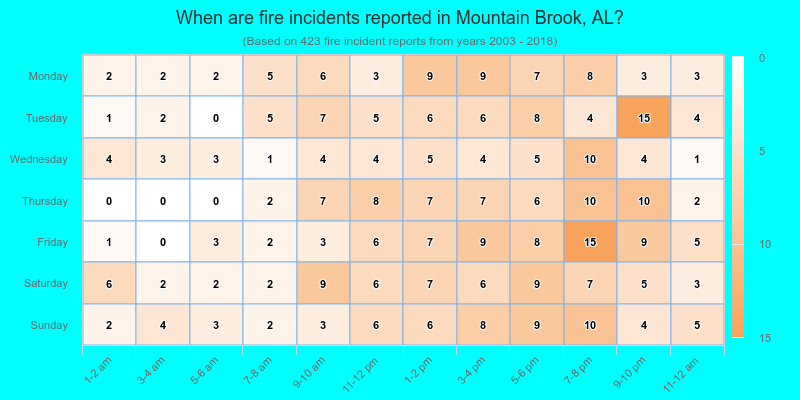
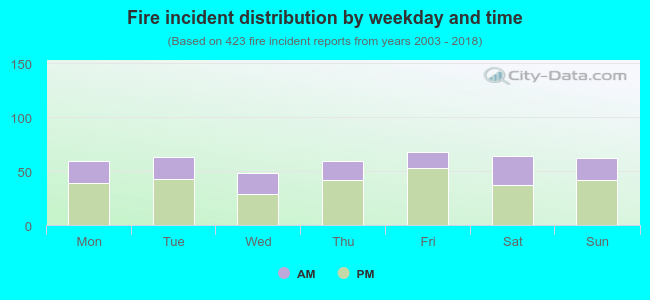 32.6% incidents where reported in the morning and 67.4% in the evening. The most fires (16.1%) took place on Friday, and the least (11.3%) on Wednesday.
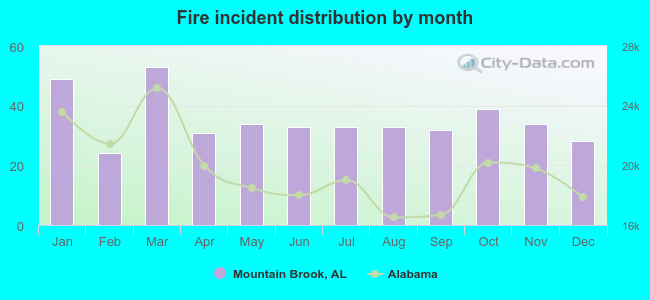 Based on the 423 fire incident reports from years 2003 - 2018 most fires (12.5%) took place during March, and the least (5.7%) in February.
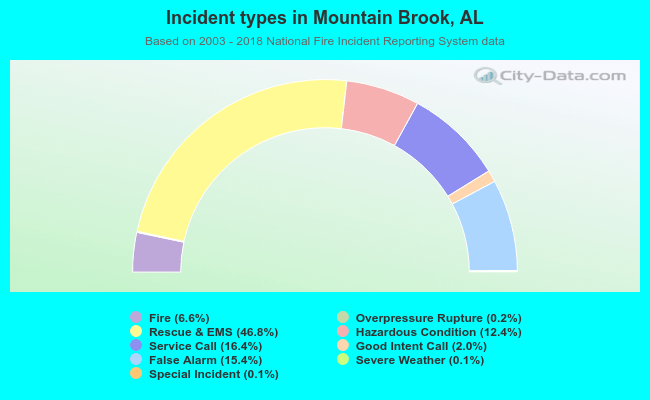 Out of all 6,379 cases reported during the years 2003 - 2018, the most belonged to the categories: Rescue & EMS (46.8%), Service Call (16.4%), and False Alarm (15.4%).
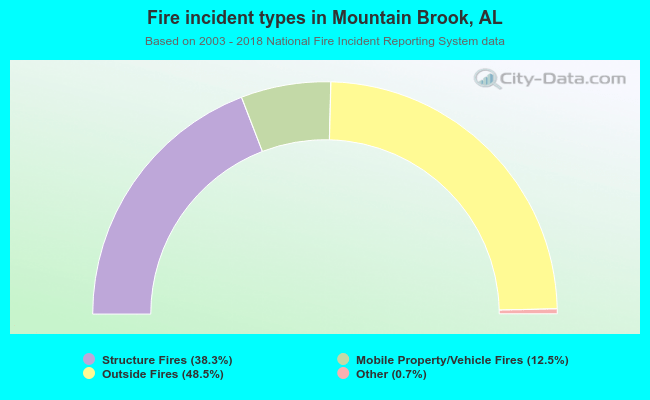 When looking into fire subcategories, the most incidents belonged to: Outside Fires (48.5%), and Structure Fires (38.3%).