Mountain Top: Fire Incidents, Pennsylvania (PA)
Where are fire incidents reported in Mountain Top, PA
Something went wrong! Please refresh the page.
|
| |||||||||||||||||||||||||||||||||||||||||||||||||||||||||||||||||||||||||||||||||||||||||||||||||||||||||||||
2010 - 2018 National Fire Incident Reporting System (NFIRS) incidents
- Incident types reported to NFIRS in Mountain Top, PA
- 33629.0%Rescue & EMS
- 22219.2%Good Intent Call
- 22219.2%False Alarm
- 13011.2%Fire
- 11710.1%Hazardous Condition
- 706.1%Service Call
- 302.6%Severe Weather
- 232.0%Special Incident
- 70.6%Overpressure Rupture
- Fire incident types reported to NFIRS in Mountain Top, PA
- 6247.7%Structure Fires
- 4030.8%Outside Fires
- 2418.5%Mobile Property/Vehicle Fires
- 43.1%Other
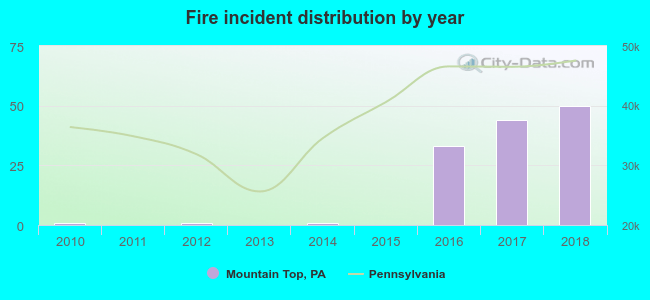 According to the data from the years 2010 - 2018 the average number of fire incidents per year is 14. The highest number of fire incidents - 50 took place in 2018, and the least - 0 in 2011. The data has a rising trend.
The average number of yearly fire incidents per 10k residents in Mountain Top, PA compared to nearest cities:
(Note: Based on data for the last 3 years, including only cities with population 5,000 and above)
| Mountain Top: | 38.5 |
| Nanticoke: | 36.6 |
| Plymouth: | 23.3 |
| Kingston: | 57.5 |
| Swoyersville: | 4.7 |
| Hazleton: | 50.4 |
| Exeter: | 58.3 |
| Pittston: | 52.9 |
| Berwick: | 47.8 |
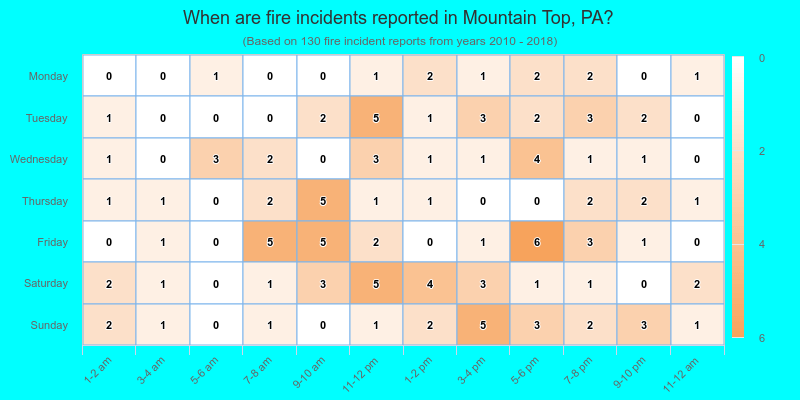
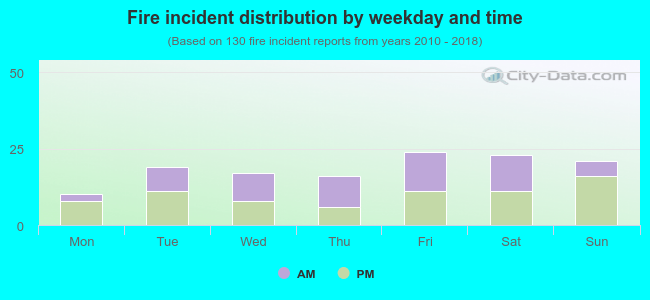 45.4% incidents where reported in the morning and 54.6% in the evening. The most fires (18.5%) took place on Friday, and the least (7.7%) on Monday.
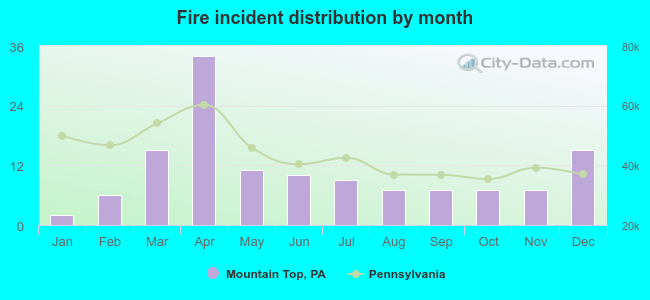 According to the 130 fire incident reports from years 2010 - 2018 most fires (26.2%) took place during April, and the least (1.5%) in January.
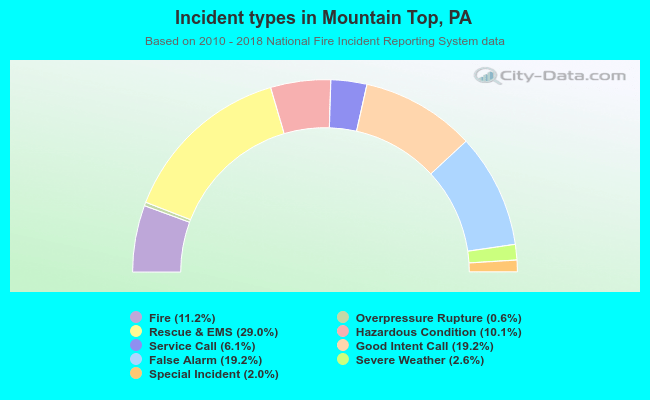 Out of all 1,157 cases reported during the years 2010 - 2018, the most belonged to the categories: Rescue & EMS (29.0%), Good Intent Call (19.2%), and False Alarm (19.2%).
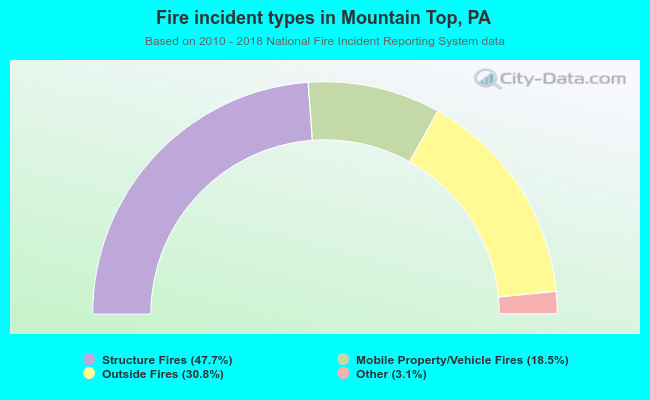 When looking into fire subcategories, the most reports belonged to: Structure Fires (47.7%), and Outside Fires (30.8%).