Mulberry: Fire Incidents, Indiana (IN)
Where are fire incidents reported in Mulberry, IN
Something went wrong! Please refresh the page.
|
| |||||||||||||||||||||||||||||||||||||||||||||||||||||||||||||||||||||||||||||||||||||||||||||||||||||||||||||
2002 - 2017 National Fire Incident Reporting System (NFIRS) incidents
- Incident types reported to NFIRS in Mulberry, IN
- 11844.7%Fire
- 6424.2%Rescue & EMS
- 3613.6%Hazardous Condition
- 207.6%Service Call
- 166.1%Good Intent Call
- 72.7%False Alarm
- 31.1%Special Incident
- Fire incident types reported to NFIRS in Mulberry, IN
- 4639.0%Structure Fires
- 4033.9%Outside Fires
- 2016.9%Other
- 1210.2%Mobile Property/Vehicle Fires
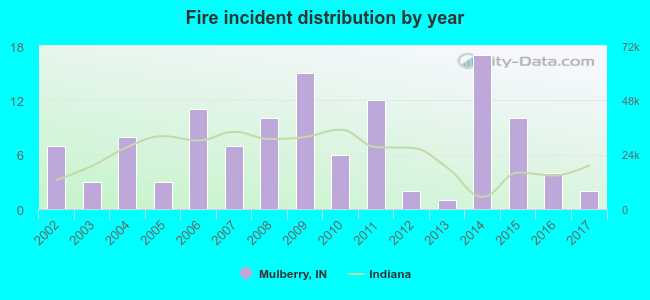 Based on the data from the years 2002 - 2017 the average number of fire incidents per year is 7. The highest number of fires - 17 took place in 2014, and the least - 1 in 2013. The data has a dropping trend.
 28.8% incidents where reported in the morning and 71.2% in the evening. The most fires (19.5%) took place on Saturday, and the least (10.2%) on Monday.
 According to the 118 fire incidents from years 2002 - 2017 most fires (19.5%) took place during August, and the least (3.4%) in January.
 Out of all 264 cases reported during the years 2002 - 2017, the most belonged to the categories: Fire (44.7%), Overpressure Rupture (24.2%), and Rescue & EMS (13.6%).
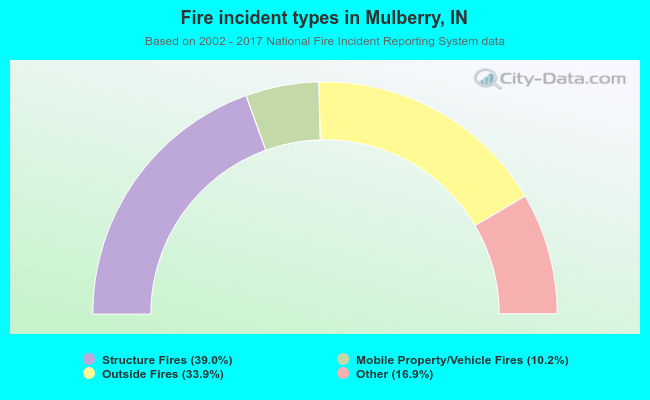 When looking into fire subcategories, the most reports belonged to: Structure Fires (39.0%), and Outside Fires (33.9%).