| Fire incidents reported |
|---|
| Sreet name | Count |
|---|
| 83981 DISMAL RIVER RD | 4 | | HIGHWAY 97 | 4 | | 1 MI EAST MULLEN | 2 | | 106 NE 2ND ST. | 2 | | 2 | 2 | | 202 SE 1ST STREET | 2 | | 206 N LINCOLN AVE | 2 | | 206 SW 1ST STREET | 2 | | 29291 N COBLE RD | 2 | | 304 S BLAINE | 2 | | 306 SE 1ST | 2 | | 36000 MULE DEER MALL | 2 | | 36521 CHOKE CHERRY DR | 2 | | 37023 | 2 | | 37091 BIG CREEK RD | 2 | | 4TH & LINCOLN AVE | 2 | | 503 NORTH LINCLON | 2 | | 6 NORTH AND 8 WEST | 2 | | 77 HWY 97 | 2 | | 83040 DISMAL RIVER T | 2 |
| | | Fire incidents reported |
|---|
| Sreet name | Count |
|---|
| 83040 DISMAL RIVER TR | 2 | | 83040 DISMAL RIVER TRAIL | 2 | | 85271 QUARTER CIRCLE DR | 2 | | 85931 N HY 97 | 2 | | 86041 CEDER DR | 2 | | 86091 DOUBLE R DR | 2 | | 87328 WOLFENDEN RD | 2 | | 97 | 2 | | CALF CREEK RD | 2 | | CEDAR DR | 2 | | CHKE CHERRY RD | 2 | | HIGHWAY 2 | 2 | | HWY 2 | 2 | | LINCOLN | 2 | | LOUP RIVER ROAD | 2 | | MM 180 HIGHWAY 2 | 2 | | N 2ND AND LAIRD | 2 | | NORTH 10 MILLES & 5 | 2 | | VIRGINIA RD | 2 | | WASHINGTON | 2 |
|
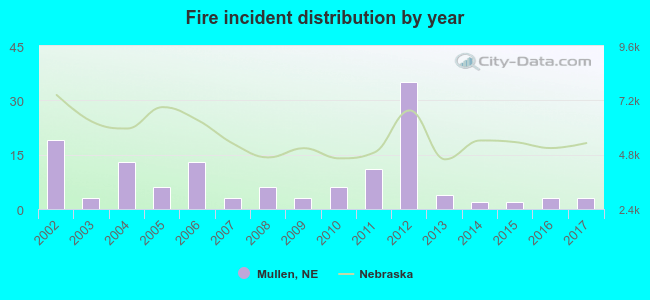 According to the data from the years 2002 - 2017 the average number of fires per year is 8. The highest number of fire incidents - 35 took place in 2012, and the least - 2 in 2014. The data has a decreasing trend.
 19.7% incidents where reported in the morning and 80.3% in the evening. The most fires (19.7%) took place on Wednesday, and the least (11.4%) on Thursday.
 Based on the 132 fire incidents from years 2002 - 2017 most fires (20.5%) took place during July, and the least (2.3%) in January.
 Out of all 151 cases reported during the years 2002 - 2017, the most belonged to the categories: Fire (87.4%), Overpressure Rupture (5.3%), and Hazardous Condition (4.6%).
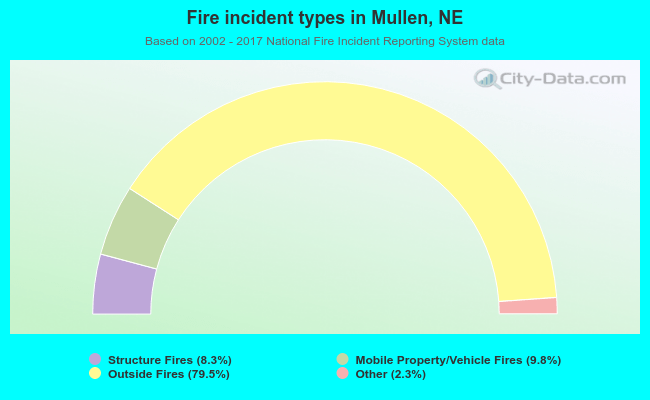 When looking into fire subcategories, the most reports belonged to: Outside Fires (79.5%), and Mobile Property/Vehicle Fires (9.8%).