| Fire incidents reported |
|---|
| Sreet name | Count |
|---|
| HWY 301 SOUTH | 22 | | HWY 26 EAST | 20 | | HWY 27 NORTH | 14 | | NORTH MAPLE | 12 | | HWY 19 NORTH | 10 | | NORTH WASHINGTON | 10 | | SOUTH WASHINGTON | 10 | | 2ND AVENUE | 8 | | HWY 27 SOUTH | 8 | | NORTH MAPLE STREET | 8 | | CHARLES ST | 6 | | HEAD ROAD | 6 | | HWY 27 | 6 | | PINE AVENUE | 6 | | ROY ROAD | 6 | | 1007 PIKE CITY RD | 4 | | 75 BROCK SPRINGS RD | 4 | | BASS LANE | 4 | | HWY 19 N | 4 | | KA DO HA ROAD | 4 | | KADOHA RD | 4 | | MUDDY FORK RD | 4 | | RIDGE ROAD | 4 | | SOUR SPRINGS ROAD | 4 | | SWEET HOME ROAD | 4 |
| | | Fire incidents reported |
|---|
| Sreet name | Count |
|---|
| WASHINGTON ST | 4 | | 1 OAK ST | 2 | | 103 BASS LANE | 2 | | 103 BASS LN | 2 | | 103 BILLY WINN | 2 | | 103 OWENS ST | 2 | | 1085 HWY 26 EAST | 2 | | 111 CHARLES STREET | 2 | | 112 MORGAN ST. | 2 | | 1127 N MAPLE | 2 | | 114 TERRELL ST | 2 | | 1156 HWY 26 | 2 | | 1158 HIGHWAY 27 S | 2 | | 117 2ND AVE | 2 | | 1230 NORH MAPLE | 2 | | 1230 NORTH MAPLE ST | 2 | | 133 OLD FACTORY SITE RD | 2 | | 1346 MUDDY FORK ROAD | 2 | | 1376 HWY 27 SOUTH | 2 | | 1401 SOUTH W & 3RD. AVE. | 2 | | 142 PARK ST | 2 | | 1499 HWY 27 N | 2 | | 1540 NATHAN RD. | 2 | | 1587 PIKE CITY ROAD | 2 | | 1629 NORTH WASHINGTON | 2 |
|
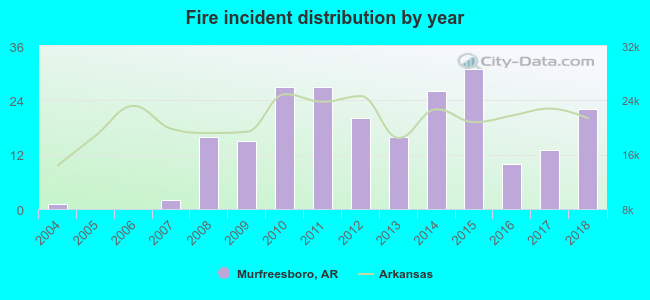 According to the data from the years 2004 - 2018 the average number of fire incidents per year is 15. The highest number of fire incidents - 31 took place in 2015, and the least - 0 in 2005. The data has an increasing trend.
 24.8% incidents where reported in the morning and 75.2% in the evening. The most fires (17.7%) took place on Sunday, and the least (10.6%) on Thursday.
 Based on the 226 reports from years 2004 - 2018 most fires (14.2%) took place during March, and the least (4.4%) in December.
 Out of all 460 cases reported during the years 2004 - 2018, the most belonged to the categories: Fire (49.1%), Overpressure Rupture (33.9%), and Rescue & EMS (7.2%).
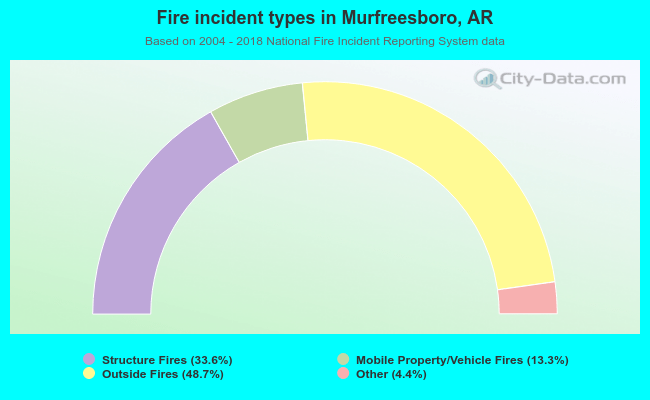 When looking into fire subcategories, the most incidents belonged to: Outside Fires (48.7%), and Structure Fires (33.6%).