Napavine: Fire Incidents, Washington (WA)
Where are fire incidents reported in Napavine, WA
Something went wrong! Please refresh the page.
|
| |||||||||||||||||||||||||||||||||||||||||||||||||||||||||||||||||||||||||||||||||||||||||||||||||||||||||||||
2002 - 2018 National Fire Incident Reporting System (NFIRS) incidents
- Incident types reported to NFIRS in Napavine, WA
- 1,36372.2%Rescue & EMS
- 26414.0%Fire
- 955.0%Good Intent Call
- 673.6%False Alarm
- 593.1%Service Call
- 271.4%Hazardous Condition
- 100.5%Special Incident
- Fire incident types reported to NFIRS in Napavine, WA
- 9536.0%Structure Fires
- 6625.0%Outside Fires
- 6223.5%Mobile Property/Vehicle Fires
- 4115.5%Other
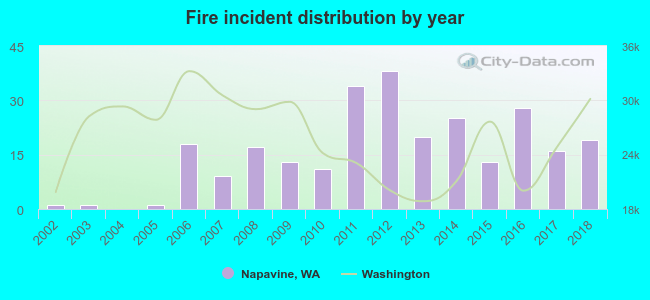 Based on the data from the years 2002 - 2018 the average number of fires per year is 16. The highest number of fire incidents - 38 took place in 2012, and the least - 0 in 2004. The data has an increasing trend.
 33.3% incidents where reported in the morning and 66.7% in the evening. The most fires (20.1%) took place on Monday, and the least (10.6%) on Tuesday.
 Based on the 264 fires from years 2002 - 2018 most fires (14.4%) took place during June, and the least (4.2%) in January.
 Out of all 1,887 cases reported during the years 2002 - 2018, the most belonged to the categories: Rescue & EMS (72.2%), Fire (14.0%), and Good Intent Call (5.0%).
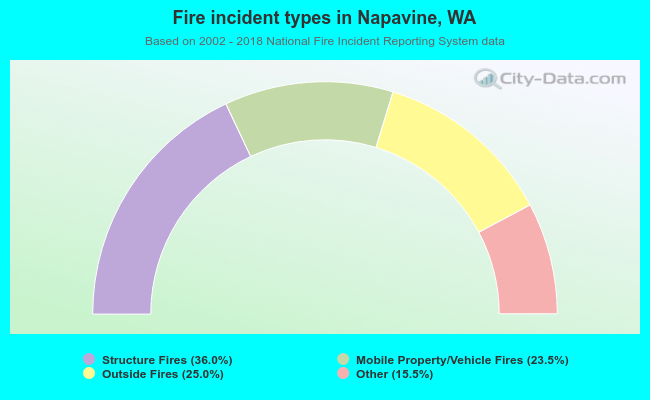 When looking into fire subcategories, the most reports belonged to: Structure Fires (36.0%), and Outside Fires (25.0%).