Naples: Fire Incidents, New York (NY)
Where are fire incidents reported in Naples, NY
Something went wrong! Please refresh the page.
|
| |||||||||||||||||||||||||||||||||||||||||||||||||||||||||||||||||||||||||||||||||||||||||||||||||||||||||||||
2002 - 2018 National Fire Incident Reporting System (NFIRS) incidents
- Incident types reported to NFIRS in Naples, NY
- 45130.3%Hazardous Condition
- 31721.3%Rescue & EMS
- 30320.4%Fire
- 15010.1%False Alarm
- 1268.5%Service Call
- 1016.8%Good Intent Call
- 342.3%Severe Weather
- 40.3%Special Incident
- 20.1%Overpressure Rupture
- Fire incident types reported to NFIRS in Naples, NY
- 12541.3%Outside Fires
- 12440.9%Structure Fires
- 289.2%Mobile Property/Vehicle Fires
- 268.6%Other
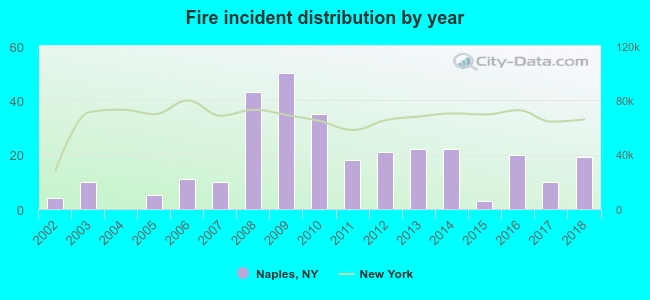 According to the data from the years 2002 - 2018 the average number of fire incidents per year is 18. The highest number of reported fires - 50 took place in 2009, and the least - 0 in 2004. The data has an increasing trend.
 According to the data from the years 2002 - 2018 the average number of fire-related casualties per year is 0. The highest number of reported casualties - 1 took place in 2011, and the lowest - 0 in 2002. The data has a constant trend.
 28.1% incidents where reported in the morning and 71.9% in the evening. The most fires (17.5%) took place on Monday, and the least (11.9%) on Friday.
 According to the 303 reports from years 2002 - 2018 most fires (22.4%) took place during April, and the least (2.6%) in December.
 Out of all 1,488 cases reported during the years 2002 - 2018, the most belonged to the categories: Hazardous Condition (30.3%), Rescue & EMS (21.3%), and Fire (20.4%).
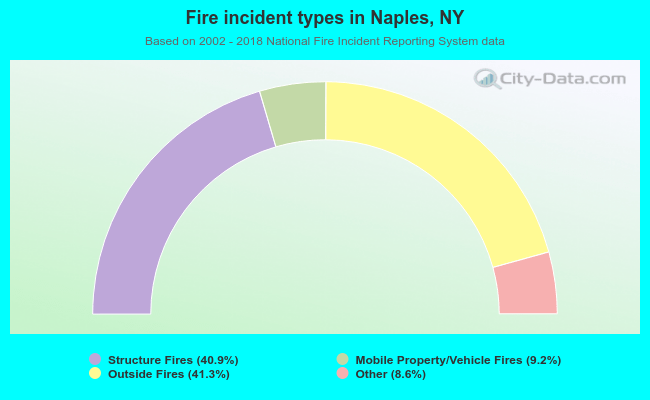 When looking into fire subcategories, the most incidents belonged to: Outside Fires (41.3%), and Structure Fires (40.9%).