Nash: Fire Incidents, Texas (TX)
Where are fire incidents reported in Nash, TX
Something went wrong! Please refresh the page.
|
| |||||||||||||||||||||||||||||||||||||||||||||||||||||||||||||||||||||||||||||||||||||||||||||||||||||||||||||
2002 - 2018 National Fire Incident Reporting System (NFIRS) incidents
- Incident types reported to NFIRS in Nash, TX
- 25238.3%Rescue & EMS
- 18928.7%Fire
- 11617.6%Hazardous Condition
- 507.6%Good Intent Call
- 304.6%Service Call
- 162.4%False Alarm
- 40.6%Severe Weather
- 10.2%Overpressure Rupture
- Fire incident types reported to NFIRS in Nash, TX
- 8846.6%Outside Fires
- 8042.3%Structure Fires
- 2010.6%Mobile Property/Vehicle Fires
- 10.5%Other
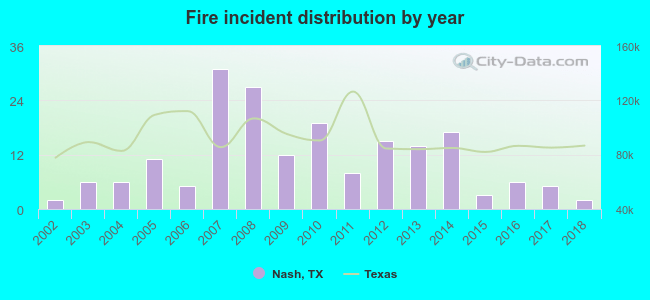 Based on the data from the years 2002 - 2018 the average number of fire incidents per year is 11. The highest number of fire incidents - 31 took place in 2007, and the least - 2 in 2002. The data has a constant trend.
 30.7% incidents where reported in the morning and 69.3% in the evening. The most fires (20.6%) took place on Tuesday, and the least (6.9%) on Saturday.
 According to the 189 fire incidents from years 2002 - 2018 most fires (16.9%) took place during January, and the least (1.6%) in November.
 Out of all 658 cases reported during the years 2002 - 2018, the most belonged to the categories: Rescue & EMS (38.3%), Fire (28.7%), and Hazardous Condition (17.6%).
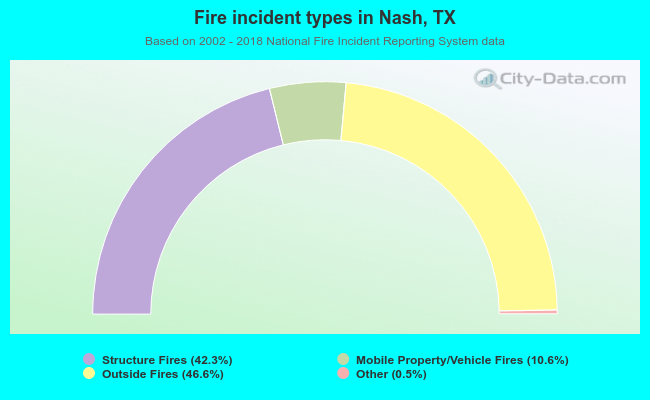 When looking into fire subcategories, the most reports belonged to: Outside Fires (46.6%), and Structure Fires (42.3%).