Nashville: Fire Incidents, Michigan (MI)
Where are fire incidents reported in Nashville, MI
Something went wrong! Please refresh the page.
|
| |||||||||||||||||||||||||||||||||||||||||||||||||||||||||||||||||||||||||||||||||||||||||||||||||||||||||||||
2002 - 2018 National Fire Incident Reporting System (NFIRS) incidents
- Incident types reported to NFIRS in Nashville, MI
- 40732.7%Rescue & EMS
- 38831.2%Fire
- 25620.6%Hazardous Condition
- 1048.4%Good Intent Call
- 594.7%Service Call
- 191.5%False Alarm
- 60.5%Special Incident
- 20.2%Overpressure Rupture
- 20.2%Severe Weather
- Fire incident types reported to NFIRS in Nashville, MI
- 19049.0%Structure Fires
- 13935.8%Outside Fires
- 5213.4%Mobile Property/Vehicle Fires
- 71.8%Other
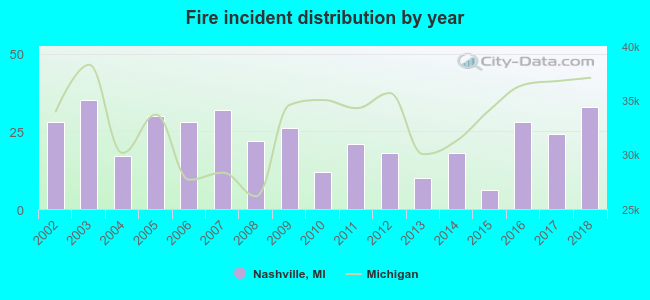 According to the data from the years 2002 - 2018 the average number of fires per year is 23. The highest number of fires - 35 took place in 2003, and the least - 6 in 2015. The data has an increasing trend.
 According to the reports from the years 2002 - 2018 the average number of fire-related yearly casualties is 0. The highest number of casualties - 1 took place in 2003, and the lowest - 0 in 2002. The data has a constant trend.
 28.9% incidents where reported in the morning and 71.1% in the evening. The most fires (18.3%) took place on Sunday, and the least (9.5%) on Wednesday.
 According to the 388 incident reports from years 2002 - 2018 most fires (21.4%) took place during April, and the least (5.2%) in August.
 Out of all 1,243 cases reported during the years 2002 - 2018, the most belonged to the categories: Rescue & EMS (32.7%), Fire (31.2%), and Hazardous Condition (20.6%).
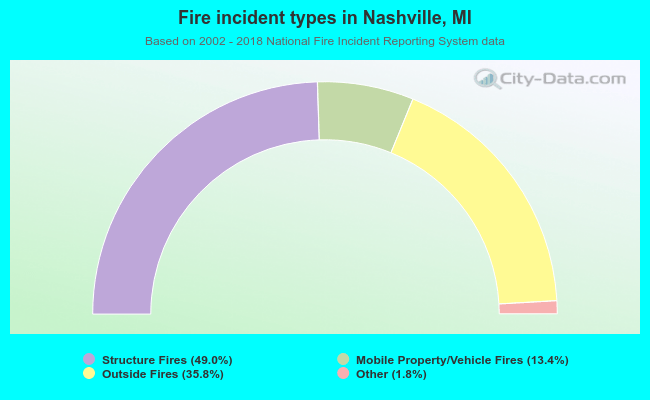 When looking into fire subcategories, the most reports belonged to: Structure Fires (49.0%), and Outside Fires (35.8%).