Natchitoches: Fire Incidents, Louisiana (LA)
Where are fire incidents reported in Natchitoches, LA
Something went wrong! Please refresh the page.
| Fire incidents reported | |
|---|---|
| Sreet name | Count |
| KEYSER AVE | 92 |
| SOUTH DR | 80 |
| INTERSTATE 49 | 78 |
| HIGHWAY 1 | 44 |
| NORTH ST | 44 |
| FAIRGROUNDS RD | 42 |
| HWY 1 BYP | 42 |
| UNIVERSITY PKY | 42 |
| HIGHWAY 3191 | 38 |
| HIGHWAY 6 EAST | 38 |
| JOHNSON CHUTE | 38 |
| WASHINGTON ST | 38 |
| DIXIE ST | 36 |
| EIGHT MILE LOOP | 36 |
| TEXAS ST | 36 |
| HIGHWAY 494 | 34 |
| WILLIAMS AVE | 34 |
| BRICKYARD ROAD | 32 |
| HIGHWAY 504 | 32 |
| HIGHWAY 1 SOUTH | 32 |
| SECOND ST | 32 |
| I49 SOUTH | 30 |
| BERRY AVE | 28 |
| MARTIN LUTHER KING DR | 28 |
| HIGHWAY 6 WEST | 26 |
| CLARENCE DR | 24 |
| WOODYARD DR | 24 |
| ROWENA ST | 22 |
| UNIVERSITY | 22 |
| BEVERLY RISE PL | 20 |
| Other | 712 |
2003 - 2018 National Fire Incident Reporting System (NFIRS) incidents
- Incident types reported to NFIRS in Natchitoches, LA
- 6,78858.9%Rescue & EMS
- 1,85616.1%Fire
- 1,21410.5%False Alarm
- 1,1419.9%Hazardous Condition
- 2452.1%Service Call
- 2372.1%Good Intent Call
- 260.2%Overpressure Rupture
- 120.1%Special Incident
- Fire incident types reported to NFIRS in Natchitoches, LA
- 78842.5%Outside Fires
- 60632.7%Structure Fires
- 35619.2%Mobile Property/Vehicle Fires
- 1065.7%Other
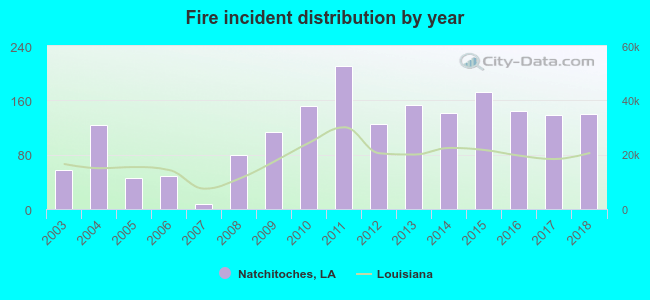 Based on the data from the years 2003 - 2018 the average number of fires per year is 116. The highest number of reported fires - 210 took place in 2011, and the least - 8 in 2007. The data has an increasing trend.
The average number of yearly fire incidents per 10k residents in Natchitoches, LA compared to nearest cities:
(Note: Based on data for the last 3 years, including only cities with population 5,000 and above)
| Natchitoches: | 76.7 |
| Mansfield: | 78.6 |
| Leesville: | 200.7 |
| Alexandria: | 83.9 |
| Pineville: | 155.1 |
 The median response time based on all reported fire incidents is 5 minutes. This is lower compared to the state median value.
The median response time in Natchitoches, LA compared to nearest cities:
(Note: Based on data for all years, including only cities with at least 500 fire incidents)
| Natchitoches: | 5 minutes |
| Campti: | 8 minutes |
| Coushatta: | 9 minutes |
| Winnfield: | 8 minutes |
| Boyce: | 10 minutes |
| Jonesboro: | 3 minutes |
| Mansfield: | 6 minutes |
| Ringgold: | 8 minutes |
| Pollock: | 12 minutes |
 According to the reports from the years 2003 - 2018 the average number of fire-related fatalities per year is 0. The highest number of reported deaths - 2 took place in 2010, and the lowest - 0 in 2003. The data has a rising trend.
 Based on the data from the years 2003 - 2018 the average number of fire-related yearly casualties is 0. The highest number of reported injuries - 1 took place in 2012, and the lowest - 0 in 2003. The data has a rising trend.
The average number of injuries per 1,000 fires is 2. This indicator was the highest - 8 in 2012, and the lowest 0 in 2003. The trend for injuries per 1,000 incidents is increasing. Compared to the Louisiana value the number of casualties per 1,000 fires is much lower.
Based on the data from the years 2003 - 2018 the average number of fire-related yearly casualties is 0. The highest number of reported injuries - 1 took place in 2012, and the lowest - 0 in 2003. The data has a rising trend.
The average number of injuries per 1,000 fires is 2. This indicator was the highest - 8 in 2012, and the lowest 0 in 2003. The trend for injuries per 1,000 incidents is increasing. Compared to the Louisiana value the number of casualties per 1,000 fires is much lower.
 30.9% incidents where reported in the morning and 69.1% in the evening. The most fires (15.8%) took place on Friday, and the least (13.1%) on Sunday.
 According to the 1,856 fires from years 2003 - 2018 most fires (9.4%) took place during August, and the least (6.5%) in June.
 Out of all 11,527 cases reported during the years 2003 - 2018, the most belonged to the categories: Rescue & EMS (58.9%), Fire (16.1%), and False Alarm (10.5%).
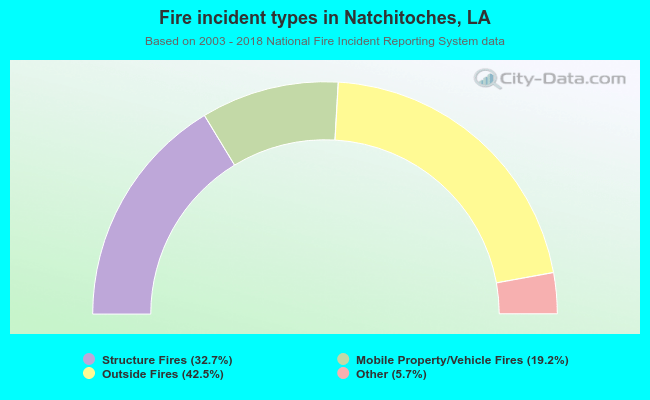 When looking into fire subcategories, the most incidents belonged to: Outside Fires (42.5%), and Structure Fires (32.7%).