| Fire incidents reported |
|---|
| Sreet name | Count |
|---|
| 56597 HIGH RIDGE RD | 4 | | I 470 | 4 | | MAIN STREET | 4 | | SHIELDS HOLLOW RD | 4 | | SR 149 | 4 | | TROUGH RUN ROAD | 4 | | 2379 W.23RD ST | 2 | | 26TH ST | 2 | | 33 MONROE ST | 2 | | 3345 MONROE ST | 2 | | 3345 MONROE ST. | 2 | | 339 JOHNET DR | 2 | | 419 37TH ST | 2 | | 4452 NOBLE ST. | 2 | | 44TH & FRANKLIN ST | 2 | | 4685 FRANKLIN ST | 2 | | 51670 GLENCOE STEWARTSVIL | 2 | | 53878 PIKE ST | 2 | | 53878 PIKE STREET | 2 | | 53956 BELMONT ST. | 2 | | 54044 PIKE ST | 2 | | 54077 PIKE ST. | 2 | | 54214 PIKE ST | 2 | | 54863 ST JOE ST | 2 | | 55259 TROUGH RUN | 2 |
| | | Fire incidents reported |
|---|
| Sreet name | Count |
|---|
| 55259 TROUGH RUN RD | 2 | | 56339 HOSPITAL RD | 2 | | 62440 CUMBERLAND RUN RD | 2 | | 63280 SAND HILL RD | 2 | | 63405 SAND HILL ROAD | 2 | | 64140 BULL RUN RD | 2 | | 64332 SAND HILL ROAD | 2 | | 64404 BOYDS RIDGE ROAD RD | 2 | | 64749 SAND HILL ROAD | 2 | | 64800 TALBOT RD | 2 | | 65256 HOPE CHAPEL RD | 2 | | 65370 DIXON HILL RD. | 2 | | 65461 EAST ST | 2 | | 65489 MCCURDY RD | 2 | | 65711 WEST ECHO | 2 | | 66490 HUDDOCK HILL RD | 2 | | BELLMONT ST | 2 | | BELMONT STREET | 2 | | BRYCE STREET | 2 | | CENTRAL AVE | 2 | | CROOKED ST. | 2 | | DIXON HILL @ MILLER RD | 2 | | DIXON HOLLOW RD. | 2 | | ECHO RD | 2 | | |
|
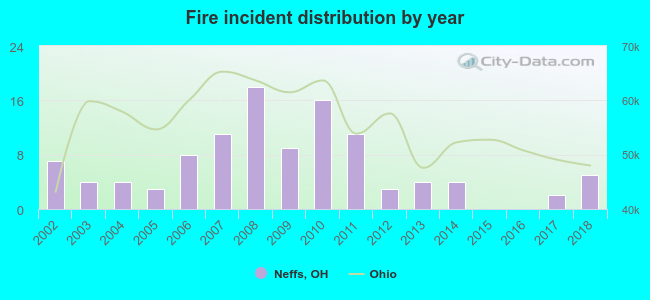 According to the data from the years 2002 - 2018 the average number of fire incidents per year is 6. The highest number of fires - 18 took place in 2008, and the least - 0 in 2015. The data has a decreasing trend.
 32.1% incidents where reported in the morning and 67.9% in the evening. The most fires (18.3%) took place on Wednesday, and the least (11.0%) on Sunday.
 Based on the 109 fire incident reports from years 2002 - 2018 most fires (12.8%) took place during March, and the least (3.7%) in October.
 Out of all 534 cases reported during the years 2002 - 2018, the most belonged to the categories: Overpressure Rupture (56.6%), Fire (20.4%), and Rescue & EMS (9.7%).
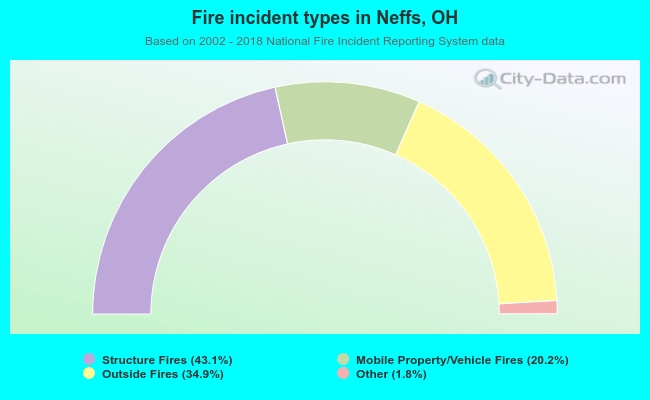 When looking into fire subcategories, the most reports belonged to: Structure Fires (43.1%), and Outside Fires (34.9%).