Negley: Fire Incidents, Ohio (OH)
Where are fire incidents reported in Negley, OH
Something went wrong! Please refresh the page.
|
| |||||||||||||||||||||||||||||||||||||||||||||||||||||||||||||||||||||||||||||||||||||||||||||||||||||||||||||
2002 - 2018 National Fire Incident Reporting System (NFIRS) incidents
- Incident types reported to NFIRS in Negley, OH
- 23846.3%Fire
- 17534.0%Rescue & EMS
- 367.0%Service Call
- 234.5%Hazardous Condition
- 183.5%Good Intent Call
- 183.5%False Alarm
- 51.0%Severe Weather
- 10.2%Overpressure Rupture
- Fire incident types reported to NFIRS in Negley, OH
- 12853.8%Structure Fires
- 7129.8%Outside Fires
- 3916.4%Mobile Property/Vehicle Fires
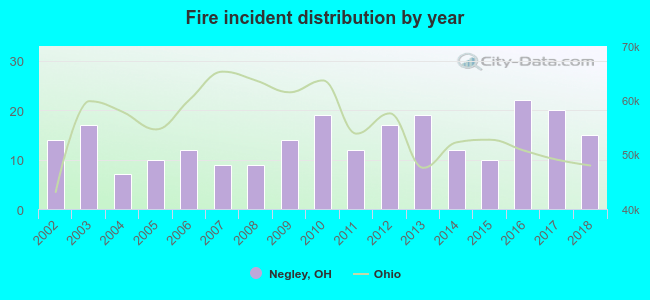 According to the data from the years 2002 - 2018 the average number of fire incidents per year is 14. The highest number of fires - 22 took place in 2016, and the least - 7 in 2004. The data has an increasing trend.
 Based on the data from the years 2002 - 2018 the average number of fire-related yearly deaths is 0. The highest number of deaths - 1 took place in 2002, and the lowest - 0 in 2004. The data has a declining trend.
 Based on the reports from the years 2002 - 2018 the average number of fire-related casualties per year is 0. The highest number of injuries - 1 took place in 2006, and the lowest - 0 in 2002. The data has a constant trend.
 28.6% incidents where reported in the morning and 71.4% in the evening. The most fires (17.2%) took place on Friday, and the least (10.9%) on Monday.
 According to the 238 fire incident reports from years 2002 - 2018 most fires (14.3%) took place during February, and the least (3.8%) in September.
 Out of all 514 cases reported during the years 2002 - 2018, the most belonged to the categories: Fire (46.3%), Rescue & EMS (34.0%), and Service Call (7.0%).
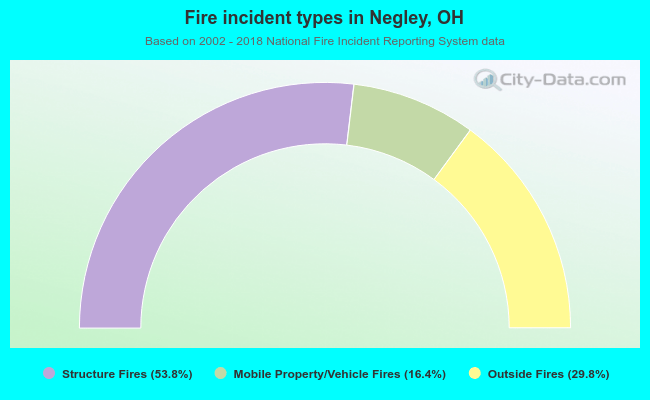 When looking into fire subcategories, the most incidents belonged to: Structure Fires (53.8%), and Outside Fires (29.8%).