Neola: Fire Incidents, Iowa (IA)
Where are fire incidents reported in Neola, IA
Something went wrong! Please refresh the page.
|
| |||||||||||||||||||||||||||||||||||||||||||||||||||||||||||||||||||||||||||||||||||||||||||||||||||||||||||||
2002 - 2016 National Fire Incident Reporting System (NFIRS) incidents
- Incident types reported to NFIRS in Neola, IA
- 11253.1%Fire
- 6530.8%Rescue & EMS
- 167.6%Hazardous Condition
- 146.6%Good Intent Call
- 20.9%Service Call
- 20.9%False Alarm
- Fire incident types reported to NFIRS in Neola, IA
- 5549.1%Outside Fires
- 2925.9%Structure Fires
- 2724.1%Mobile Property/Vehicle Fires
- 10.9%Other
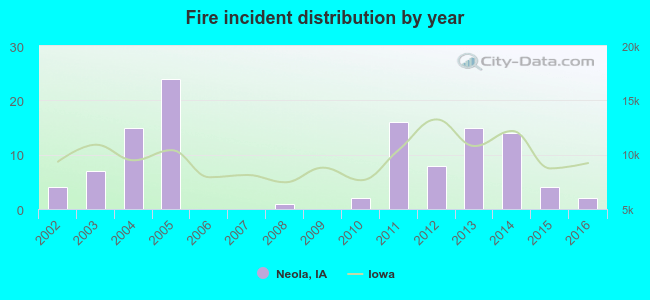 According to the data from the years 2002 - 2016 the average number of fires per year is 7. The highest number of fires - 24 took place in 2005, and the least - 0 in 2006. The data has a decreasing trend.
 31.3% incidents where reported in the morning and 68.8% in the evening. The most fires (23.2%) took place on Sunday, and the least (8.0%) on Thursday.
 According to the 112 fire incidents from years 2002 - 2016 most fires (19.6%) took place during March, and the least (3.6%) in January.
 Out of all 211 cases reported during the years 2002 - 2016, the most belonged to the categories: Fire (53.1%), Overpressure Rupture (30.8%), and Rescue & EMS (7.6%).
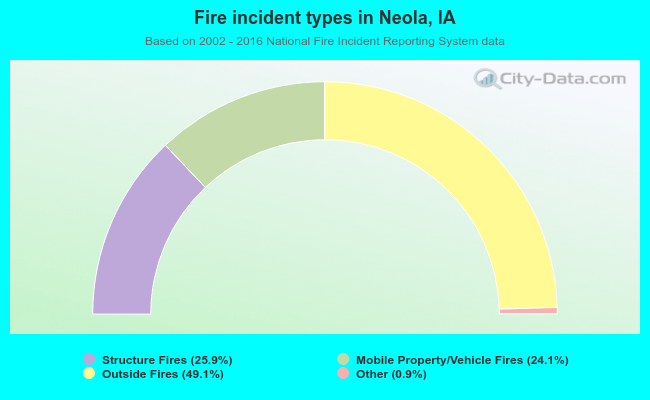 When looking into fire subcategories, the most reports belonged to: Outside Fires (49.1%), and Structure Fires (25.9%).