Netcong: Fire Incidents, New Jersey (NJ)
Where are fire incidents reported in Netcong, NJ
Something went wrong! Please refresh the page.
|
| |||||||||||||||||||||||||||||||||||||||||||||||||||||||||||||||||||||||||||||||||||||||||||||||||||||||||||||
2002 - 2018 National Fire Incident Reporting System (NFIRS) incidents
- Incident types reported to NFIRS in Netcong, NJ
- 21834.7%Hazardous Condition
- 17527.8%Fire
- 8613.7%False Alarm
- 589.2%Service Call
- 507.9%Good Intent Call
- 335.2%Rescue & EMS
- 50.8%Special Incident
- 40.6%Severe Weather
- Fire incident types reported to NFIRS in Netcong, NJ
- 12068.6%Structure Fires
- 3419.4%Outside Fires
- 148.0%Mobile Property/Vehicle Fires
- 74.0%Other
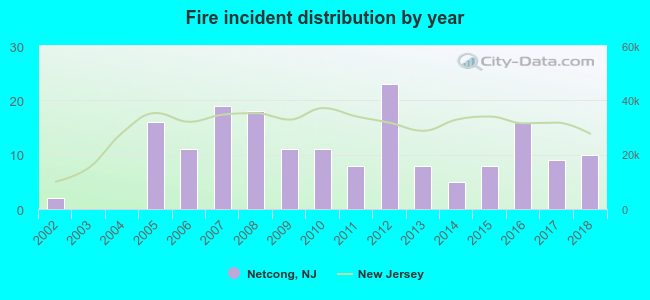 Based on the data from the years 2002 - 2018 the average number of fires per year is 10. The highest number of reported fires - 23 took place in 2012, and the least - 0 in 2003. The data has an increasing trend.
 31.4% incidents where reported in the morning and 68.6% in the evening. The most fires (17.7%) took place on Saturday, and the least (9.1%) on Wednesday.
 According to the 175 reports from years 2002 - 2018 most fires (10.9%) took place during April, and the least (4.6%) in June.
 Out of all 629 cases reported during the years 2002 - 2018, the most belonged to the categories: Rescue & EMS (34.7%), Fire (27.8%), and Good Intent Call (13.7%).
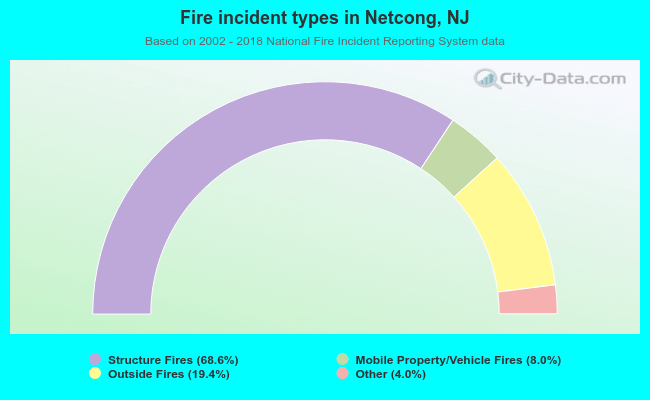 When looking into fire subcategories, the most incidents belonged to: Structure Fires (68.6%), and Outside Fires (19.4%).