| Fire incidents reported |
|---|
| Sreet name | Count |
|---|
| SR 231 | 8 | | MAIN | 6 | | US 30 | 6 | | COUNTY HIGHWAY 330 HWY | 4 | | TWP HWY 68 ST | 4 | | 10214 TWP HWY 132 | 2 | | 11507 TH133 | 2 | | 13187 ST HWY 231 | 2 | | 14977 SR 231 | 2 | | 15332 CH 135 | 2 | | 16438 SR 231 | 2 | | 17 PARK VIEW | 2 | | 180 TWP RD 62 | 2 | | 1880 CH 72 | 2 | | 18996 ST HWY. 231 | 2 | | 201 GROVE STREET HWY | 2 | | 245 NEVADA WYNFORD | 2 | | 2511 COUNTY HWY 182 | 2 | | 2638 CH 55 | 2 | | 2640 CH 74 | 2 | | 272 BUCYRUSNEVADA RD | 2 | | 305 COOK ST | 2 | | 305 RIVER RD | 2 | | 305 WEST CENTER STREET | 2 | | 311 SOUTH MAIN STREET | 2 |
| | | Fire incidents reported |
|---|
| Sreet name | Count |
|---|
| 317 NORTH GOODBREAD | 2 | | 3392 TH 52 | 2 | | 4057 PERRYSBURG RD | 2 | | 410 NORTH GOODBREAD | 2 | | 413 N MAIN ST | 2 | | 413 NORTH MAIN STREET | 2 | | 43 RD | 2 | | 56 RINEHART RD | 2 | | 754 CR 330 | 2 | | 760 CH 68 | 2 | | 800 TWP HWY 68 | 2 | | BALLIET | 2 | | C.H. 59 | 2 | | CH 128 | 2 | | CO RD NO 4 | 2 | | CO. RD. 55 | 2 | | COUNTY HIGHWAY 113 | 2 | | COUNTY HIGHWAY 134 | 2 | | COUNTY HIGHWAY 135 | 2 | | COUNTY HIGHWAY 330 | 2 | | COUNTY HIGHWAY 44 | 2 | | COUNTY HWY 10 | 2 | | COUNTY HWY 51 | 2 | | COUNTY LINE RD | 2 | | |
|
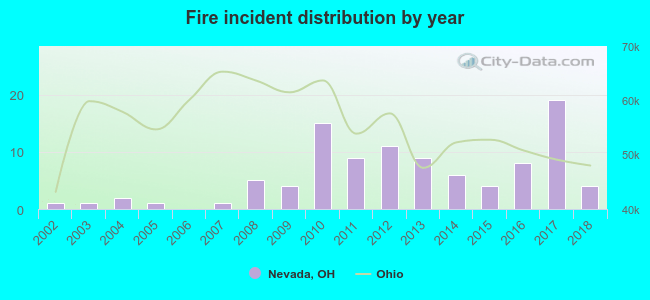 According to the data from the years 2002 - 2018 the average number of fire incidents per year is 6. The highest number of fires - 19 took place in 2017, and the least - 0 in 2006. The data has an increasing trend.
 38.0% incidents where reported in the morning and 62.0% in the evening. The most fires (22.0%) took place on Sunday, and the least (6.0%) on Tuesday.
 Based on the 100 fire incident reports from years 2002 - 2018 most fires (16.0%) took place during January, and the least (3.0%) in July.
 Out of all 144 cases reported during the years 2002 - 2018, the most belonged to the categories: Fire (69.4%), Rescue & EMS (12.5%), and Service Call (8.3%).
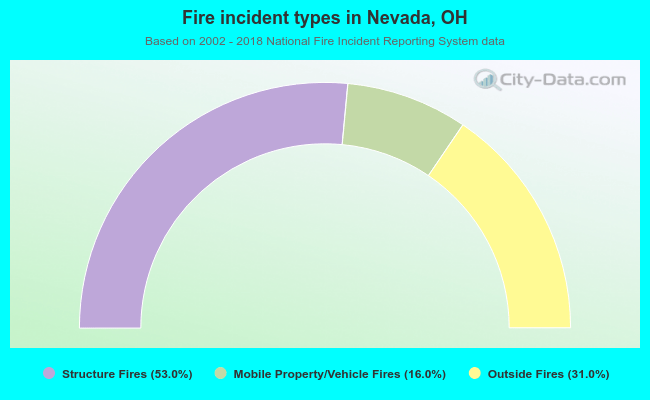 When looking into fire subcategories, the most reports belonged to: Structure Fires (53.0%), and Outside Fires (31.0%).