New Albany: Fire Incidents, Ohio (OH)
Where are fire incidents reported in New Albany, OH
Something went wrong! Please refresh the page.
|
| |||||||||||||||||||||||||||||||||||||||||||||||||||||||||||||||||||||||||||||||||||||||||||||||||||||||||||||
2002 - 2018 National Fire Incident Reporting System (NFIRS) incidents
- Incident types reported to NFIRS in New Albany, OH
- 2,82042.9%Rescue & EMS
- 1,33920.4%Good Intent Call
- 93414.2%False Alarm
- 67810.3%Hazardous Condition
- 3815.8%Fire
- 3635.5%Service Call
- 210.3%Severe Weather
- 200.3%Overpressure Rupture
- 150.2%Special Incident
- Fire incident types reported to NFIRS in New Albany, OH
- 19751.7%Structure Fires
- 11028.9%Outside Fires
- 7319.2%Mobile Property/Vehicle Fires
- 10.3%Other
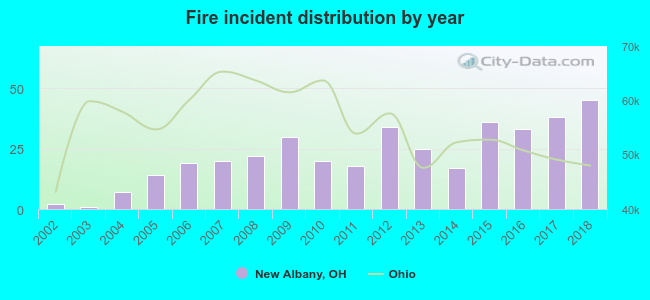 According to the data from the years 2002 - 2018 the average number of fires per year is 22. The highest number of reported fires - 45 took place in 2018, and the least - 1 in 2003. The data has a rising trend.
The average number of yearly fire incidents per 10k residents in New Albany, OH compared to nearest cities:
(Note: Based on data for the last 3 years, including only cities with population 5,000 and above)
| New Albany: | 42.0 |
| Gahanna: | 20.2 |
| Westerville: | 14.8 |
| Reynoldsburg: | 28.7 |
| Pataskala: | 73.5 |
| Whitehall: | 50.3 |
| Bexley: | 9.6 |
| Worthington: | 24.6 |
| Columbus: | 38.2 |

 31.2% incidents where reported in the morning and 68.8% in the evening. The most fires (17.6%) took place on Monday, and the least (10.5%) on Sunday.
 Based on the 381 fire incident reports from years 2002 - 2018 most fires (12.9%) took place during June, and the least (5.2%) in February.
 Out of all 6,571 cases reported during the years 2002 - 2018, the most belonged to the categories: Rescue & EMS (42.9%), Good Intent Call (20.4%), and False Alarm (14.2%).
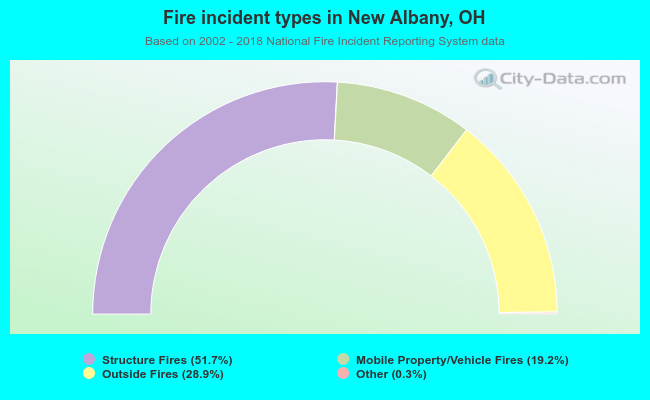 When looking into fire subcategories, the most incidents belonged to: Structure Fires (51.7%), and Outside Fires (28.9%).