New Bedford: Fire Incidents, Massachusetts (MA)
Where are fire incidents reported in New Bedford, MA
Something went wrong! Please refresh the page.
| Fire incidents reported | |
|---|---|
| Sreet name | Count |
| ACUSHNET AVE | 650 |
| PURCHASE ST | 390 |
| PLEASANT ST | 362 |
| COUNTY ST | 338 |
| ASHLEY BLVD | 198 |
| BELLEVILLE AVE | 174 |
| SAWYER ST | 170 |
| RUTH ST | 166 |
| ROCKDALE AVE | 162 |
| DARTMOUTH ST | 160 |
| BROCK AVE | 158 |
| SHAWMUT AVE | 138 |
| COGGESHALL ST | 136 |
| PHILLIPS RD | 134 |
| CHURCH ST | 132 |
| COTTAGE ST | 124 |
| KEMPTON ST | 122 |
| COVE RD | 118 |
| HATHAWAY RD | 104 |
| SUMMER ST | 104 |
| UNION ST | 102 |
| N FRONT ST | 90 |
| COFFIN AVE | 86 |
| RODNEY FRENCH BLVD | 82 |
| MT PLEASANT ST | 80 |
| COLLETTE ST | 78 |
| DEANE ST | 76 |
| KINGS HWY | 76 |
| NASH RD | 74 |
| ELM ST | 70 |
| Other | 1,999 |
2002 - 2018 National Fire Incident Reporting System (NFIRS) incidents
- Incident types reported to NFIRS in New Bedford, MA
- 43,72059.6%Rescue & EMS
- 9,43912.9%False Alarm
- 6,8539.3%Fire
- 5,1937.1%Hazardous Condition
- 4,9716.8%Good Intent Call
- 2,9764.1%Service Call
- 1070.1%Special Incident
- Fire incident types reported to NFIRS in New Bedford, MA
- 2,93142.8%Structure Fires
- 2,34434.2%Outside Fires
- 1,23818.1%Mobile Property/Vehicle Fires
- 3405.0%Other
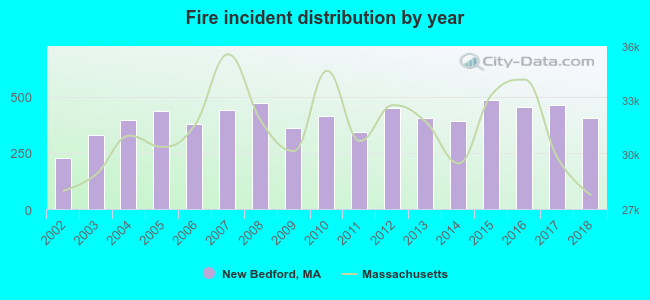 According to the data from the years 2002 - 2018 the average number of fires per year is 403. The highest number of reported fire incidents - 484 took place in 2015, and the least - 225 in 2002. The data has an increasing trend.
The average number of yearly fire incidents per 10k residents in New Bedford, MA compared to nearest cities:
(Note: Based on data for the last 3 years, including only cities with population 5,000 and above)
| New Bedford: | 46.5 |
| Fairhaven: | 30.2 |
| Dartmouth: | 22.3 |
| Acushnet: | 21.7 |
| Mattapoisett: | 32.5 |
| Westport: | 41.0 |
| Freetown: | 4.5 |
| Rochester: | 13.4 |
| Fall River: | 48.8 |
 The median response time based on all reported fire incidents is 4 minutes. This is comparable to the Massachusetts median value.
The median response time in New Bedford, MA compared to nearest cities:
(Note: Based on data for all years, including only cities with at least 500 fire incidents)
| New Bedford: | 4 minutes |
| Fairhaven: | 3 minutes |
| Dartmouth: | 6 minutes |
| Westport: | 5 minutes |
| Fall River: | 5 minutes |
| Lakeville: | 6 minutes |
| Somerset: | 6 minutes |
| Wareham: | 6 minutes |
| Onset: | 3 minutes |
 Based on the data from the years 2002 - 2018 the average number of fire-related yearly deaths is 1. The highest number of deaths - 3 took place in 2005, and the lowest - 0 in 2002. The data has an increasing trend.
The average number of deaths per 1,000 fire incidents is 2. This indicator was the highest - 7 in 2018, and the lowest 0 in 2002. The trend for deaths per 1,000 fire incidents is increasing. Compared to the Massachusetts value the number of deaths per 1,000 fire incidents is higher.
Based on the data from the years 2002 - 2018 the average number of fire-related yearly deaths is 1. The highest number of deaths - 3 took place in 2005, and the lowest - 0 in 2002. The data has an increasing trend.
The average number of deaths per 1,000 fire incidents is 2. This indicator was the highest - 7 in 2018, and the lowest 0 in 2002. The trend for deaths per 1,000 fire incidents is increasing. Compared to the Massachusetts value the number of deaths per 1,000 fire incidents is higher.Deaths per 1,000 incidents in New Bedford, MA compared to nearest cities:
(Note: Based on data for all years, including only cities with at least 2,500 fire incidents)
| New Bedford: | 2.2 |
| Fall River: | 2.6 |
| Taunton: | 3.0 |
 Based on the data from the years 2002 - 2018 the average number of fire-related casualties per year is 9. The highest number of reported injuries - 23 took place in 2003, and the lowest - 0 in 2004. The data has a rising trend.
The average number of casualties per 1,000 fire incidents is 22. This indicator was the highest - 70 in 2003, and the lowest 0 in 2004. The trend for injuries per 1,000 incidents is increasing. Compared to the Massachusetts value the number of injuries per 1,000 incidents is higher.
Based on the data from the years 2002 - 2018 the average number of fire-related casualties per year is 9. The highest number of reported injuries - 23 took place in 2003, and the lowest - 0 in 2004. The data has a rising trend.
The average number of casualties per 1,000 fire incidents is 22. This indicator was the highest - 70 in 2003, and the lowest 0 in 2004. The trend for injuries per 1,000 incidents is increasing. Compared to the Massachusetts value the number of injuries per 1,000 incidents is higher.
 32.7% incidents where reported in the morning and 67.3% in the evening. The most fires (15.1%) took place on Sunday, and the least (13.5%) on Tuesday.
 Based on the 6,853 reports from years 2002 - 2018 most fires (11.2%) took place during July, and the least (5.9%) in December.
 Out of all 73,343 cases reported during the years 2002 - 2018, the most belonged to the categories: Rescue & EMS (59.6%), False Alarm (12.9%), and Fire (9.3%).
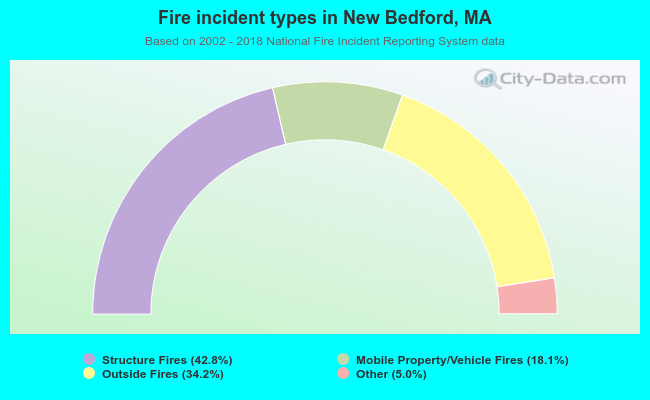 When looking into fire subcategories, the most reports belonged to: Structure Fires (42.8%), and Outside Fires (34.2%).