| Fire incidents reported |
|---|
| Sreet name | Count |
|---|
| STATE HWY 8 | 64 | | COUNTY RD 29 | 28 | | TURNPIKE RD | 26 | | STATE HWY 80 | 24 | | SCHOOL ST | 16 | | BALCOM HILL RD | 14 | | DILLEY HILL | 14 | | COUNTY RD 28 | 12 | | N MAIN ST | 12 | | S MAIN ST | 12 | | STATE HIGHWAY 8 | 10 | | BELL RD | 8 | | BRYANT RD | 8 | | CLARK LN | 8 | | COUNTY HWY 18 | 8 | | COUNTY RD 24 | 8 | | COUNTY RD 25 | 8 | | HOLDREDGE RD | 8 | | HUNTS POND RD | 8 | | LAKE RD | 8 | | NEW TURNPIKE RD | 8 | | SPURR ST | 8 | | STATE HWY 23 | 8 | | WALT PHILLIPS RD | 8 | | ACADEMY ST | 6 |
| | | Fire incidents reported |
|---|
| Sreet name | Count |
|---|
| ACADEMY STREET | 6 | | COUNTY ROUTE 29 | 6 | | CUT OFF RD | 6 | | DILLY HILL ROAD | 6 | | MAIN ST | 6 | | NEW BERLIN STATION | 6 | | PARKER RD | 6 | | RAILROAD ST | 6 | | CUT OFF RD | 4 | | HENRY ST | 4 | | NORTH MAIN STREET | 4 | | NORTH MAIN STREET ST | 4 | | NORTON RD | 4 | | PREFERRED WAY | 4 | | RT 80 EAST | 4 | | S MAIN | 4 | | SILVER LAKE RD | 4 | | STATE HIGHWAY 80 | 4 | | 1 PREFERRED WAY | 2 | | 126 STATE HWY 80 | 2 | | 4305 STATE HWY 8 | 2 | | 84 NORTH MAIN ST | 2 | | 87 NORTH MAIN STREET | 2 | | ANGELL HILL ROAD | 2 | | |
|
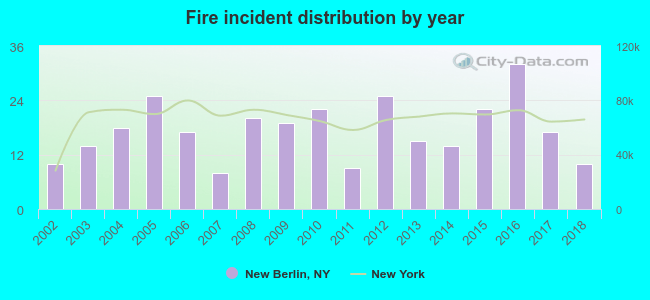 According to the data from the years 2002 - 2018 the average number of fire incidents per year is 17. The highest number of reported fire incidents - 32 took place in 2016, and the least - 8 in 2007. The data has a constant trend.
 38.0% incidents where reported in the morning and 62.0% in the evening. The most fires (19.9%) took place on Tuesday, and the least (9.4%) on Sunday.
 According to the 297 incident reports from years 2002 - 2018 most fires (16.5%) took place during April, and the least (1.7%) in October.
 Out of all 1,297 cases reported during the years 2002 - 2018, the most belonged to the categories: Hazardous Condition (39.0%), Fire (22.9%), and Rescue & EMS (16.9%).
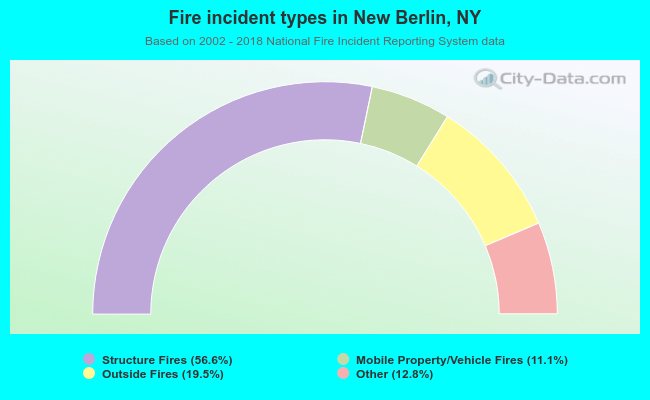 When looking into fire subcategories, the most reports belonged to: Structure Fires (56.6%), and Outside Fires (19.5%).