New Bern: Fire Incidents, North Carolina (NC)
Where are fire incidents reported in New Bern, NC
Something went wrong! Please refresh the page.
| Fire incidents reported | |
|---|---|
| Sreet name | Count |
| NEUSE BLVD | 144 |
| US 70 HWY | 140 |
| GLENBURNIE RD | 136 |
| M L KING JR BLVD | 134 |
| OLD CHERRY POINT RD | 100 |
| 70 HWY | 60 |
| TRENT RD | 58 |
| CRAVEN TER | 54 |
| M. L. KING, JR. BLVD | 52 |
| CRAVEN ST | 50 |
| ANTIOCH RD | 48 |
| WASHINGTON POST RD | 48 |
| 55 HWY | 46 |
| COUNTRY CLUB RD | 46 |
| TRENT CT | 46 |
| WALT BELLAMY DR | 40 |
| BROAD CREEK RD | 38 |
| THURMAN RD | 34 |
| FRONT ST | 32 |
| MYRTLE GROVE RD | 32 |
| COLONY DR | 30 |
| OAKS RD | 30 |
| BROAD ST | 26 |
| KENSINGTON PARK DR | 26 |
| NC HWY 55 WEST | 26 |
| RED ROBIN LN | 26 |
| TRUITT RD | 26 |
| BRUNSWICK AVE | 24 |
| CAROLINA PINES BLVD | 24 |
| ELIZABETH AVE | 24 |
| Other | 1,854 |
2002 - 2018 National Fire Incident Reporting System (NFIRS) incidents
- Incident types reported to NFIRS in New Bern, NC
- 4,78131.6%Hazardous Condition
- 3,63924.1%Rescue & EMS
- 3,45422.9%Fire
- 1,53310.1%False Alarm
- 1,1457.6%Good Intent Call
- 4703.1%Service Call
- 350.2%Special Incident
- 340.2%Severe Weather
- 230.2%Overpressure Rupture
- Fire incident types reported to NFIRS in New Bern, NC
- 1,60646.5%Structure Fires
- 1,31338.0%Outside Fires
- 42012.2%Mobile Property/Vehicle Fires
- 1153.3%Other
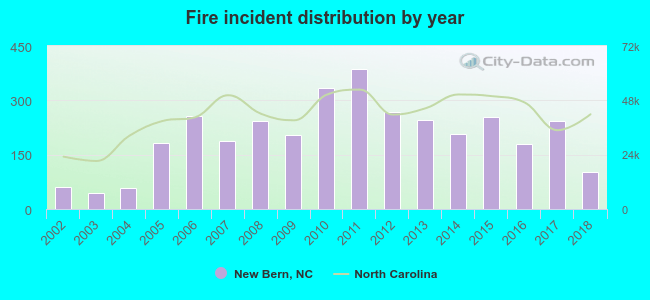 According to the data from the years 2002 - 2018 the average number of fire incidents per year is 203. The highest number of fire incidents - 387 took place in 2011, and the least - 45 in 2003. The data has an increasing trend.
The average number of yearly fire incidents per 10k residents in New Bern, NC compared to nearest cities:
(Note: Based on data for the last 3 years, including only cities with population 5,000 and above)
| New Bern: | 57.9 |
| James City: | 11.0 |
| Havelock: | 30.4 |
| Piney Green: | 3.0 |
| Half Moon: | 4.4 |
| Washington: | 112.4 |
| Jacksonville: | 37.7 |
| Kinston: | 81.3 |
| Ayden: | 102.1 |
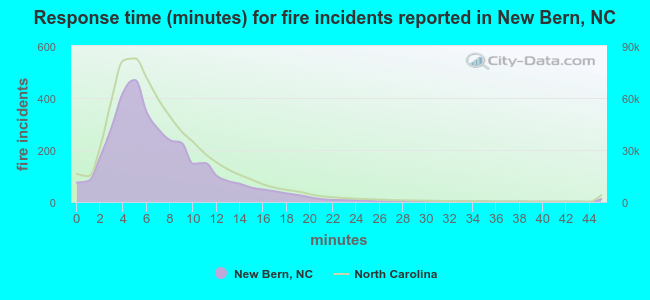 The median response time based on all reported fire incidents is 6 minutes. This is comparable to the North Carolina median value.
The median response time in New Bern, NC compared to nearest cities:
(Note: Based on data for all years, including only cities with at least 500 fire incidents)
| New Bern: | 6 minutes |
| Vanceboro: | 9 minutes |
| Trenton: | 10 minutes |
| Havelock: | 10 minutes |
| Newport: | 9 minutes |
| Grifton: | 8 minutes |
| Chocowinity: | 9 minutes |
| Swansboro: | 8 minutes |
| Emerald Isle: | 6 minutes |
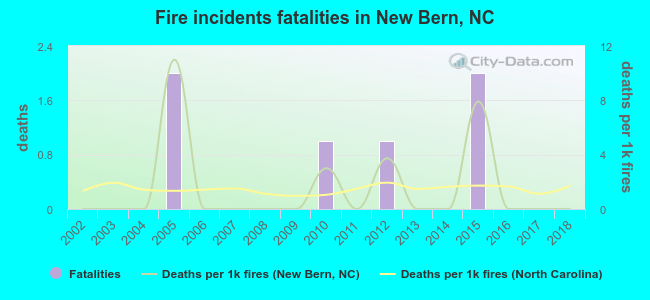 Based on the data from the years 2002 - 2018 the average number of fire-related fatalities per year is 0. The highest number of deaths - 2 took place in 2005, and the lowest - 0 in 2002. The data has a constant trend.
The average number of deaths per 1,000 fire incidents is 2. This indicator was the highest - 11 in 2005, and the lowest 0 in 2002. The trend for deaths per 1,000 fires is constant. Compared to the North Carolina value the number of fatalities per 1,000 fires is about the same.
Based on the data from the years 2002 - 2018 the average number of fire-related fatalities per year is 0. The highest number of deaths - 2 took place in 2005, and the lowest - 0 in 2002. The data has a constant trend.
The average number of deaths per 1,000 fire incidents is 2. This indicator was the highest - 11 in 2005, and the lowest 0 in 2002. The trend for deaths per 1,000 fires is constant. Compared to the North Carolina value the number of fatalities per 1,000 fires is about the same.Deaths per 1,000 incidents in New Bern, NC compared to nearest cities:
(Note: Based on data for all years, including only cities with at least 2,500 fire incidents)
| New Bern: | 1.7 |
| Jacksonville: | 1.1 |
| Kinston: | 1.6 |
| Greenville: | 1.8 |
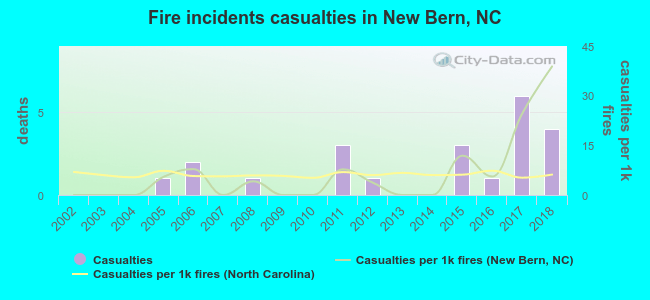 According to the reports from the years 2002 - 2018 the average number of fire-related yearly casualties is 1. The highest number of casualties - 6 took place in 2017, and the lowest - 0 in 2002. The data has a growing trend.
The average number of casualties per 1,000 fire incidents is 6. This indicator was the highest - 39 in 2018, and the lowest 0 in 2002. The trend for injuries per 1,000 fires is growing. Compared to the North Carolina value the number of casualties per 1,000 fire incidents is similar.
According to the reports from the years 2002 - 2018 the average number of fire-related yearly casualties is 1. The highest number of casualties - 6 took place in 2017, and the lowest - 0 in 2002. The data has a growing trend.
The average number of casualties per 1,000 fire incidents is 6. This indicator was the highest - 39 in 2018, and the lowest 0 in 2002. The trend for injuries per 1,000 fires is growing. Compared to the North Carolina value the number of casualties per 1,000 fire incidents is similar.Casualties per 1,000 incidents in New Bern, NC compared to nearest cities:
(Note: Based on data for all years, including only cities with at least 500 fire incidents)
| New Bern: | 6.4 |
| Vanceboro: | 4.1 |
| Trenton: | 0.0 |
| Havelock: | 3.2 |
| Newport: | 5.9 |
| Grifton: | 4.6 |
| Chocowinity: | 3.1 |
| Swansboro: | 10.8 |
| Emerald Isle: | 0.0 |
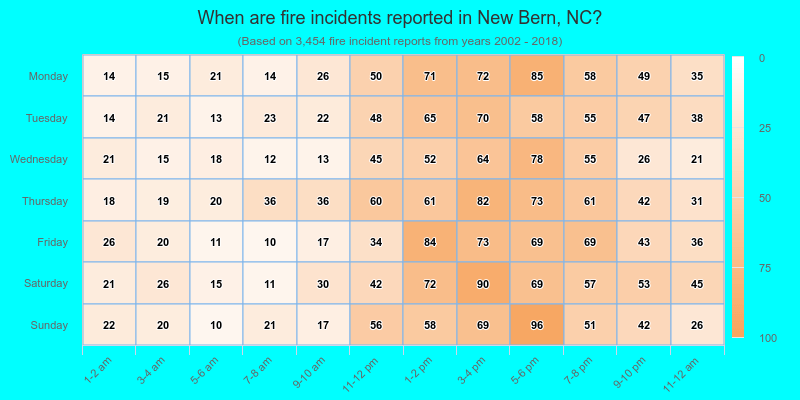
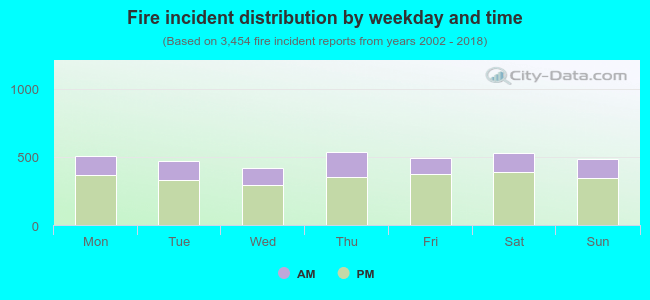 29.0% incidents where reported in the morning and 71.0% in the evening. The most fires (15.6%) took place on Thursday, and the least (12.2%) on Wednesday.
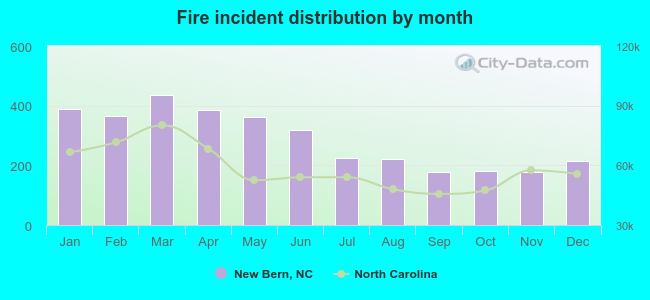 Based on the 3,454 incident reports from years 2002 - 2018 most fires (12.6%) took place during March, and the least (5.1%) in September.
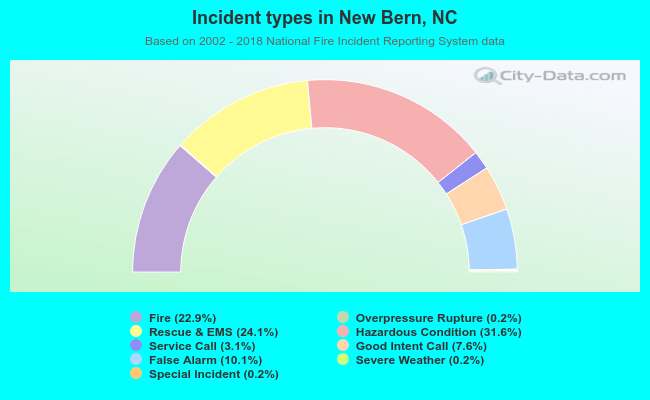 Out of all 15,114 cases reported during the years 2002 - 2018, the most belonged to the categories: Hazardous Condition (31.6%), Rescue & EMS (24.1%), and Fire (22.9%).
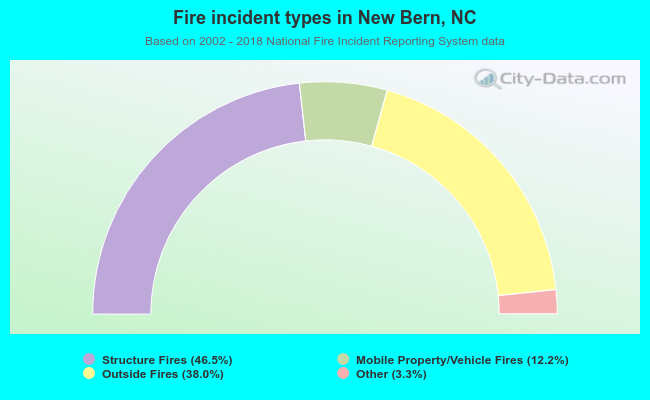 When looking into fire subcategories, the most incidents belonged to: Structure Fires (46.5%), and Outside Fires (38.0%).