New Boston: Fire Incidents, Ohio (OH)
Where are fire incidents reported in New Boston, OH
Something went wrong! Please refresh the page.
|
| |||||||||||||||||||||||||||||||||||||||||||||||||||||||||||||||||||||||||||||||||||||||||||||||||||||||||||||
2002 - 2018 National Fire Incident Reporting System (NFIRS) incidents
- Incident types reported to NFIRS in New Boston, OH
- 38922.9%Hazardous Condition
- 37822.2%Fire
- 35120.7%Rescue & EMS
- 26715.7%Service Call
- 19211.3%False Alarm
- 1046.1%Good Intent Call
- 80.5%Special Incident
- 60.4%Overpressure Rupture
- 40.2%Severe Weather
- Fire incident types reported to NFIRS in New Boston, OH
- 20153.2%Structure Fires
- 9023.8%Outside Fires
- 8522.5%Mobile Property/Vehicle Fires
- 20.5%Other
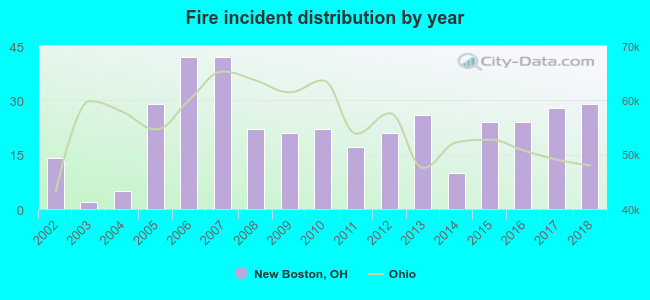 According to the data from the years 2002 - 2018 the average number of fires per year is 22. The highest number of reported fires - 42 took place in 2006, and the least - 2 in 2003. The data has a rising trend.
 34.1% incidents where reported in the morning and 65.9% in the evening. The most fires (17.2%) took place on Tuesday, and the least (7.7%) on Thursday.
 Based on the 378 fire incident reports from years 2002 - 2018 most fires (11.9%) took place during December, and the least (4.2%) in February.
 Out of all 1,699 cases reported during the years 2002 - 2018, the most belonged to the categories: Hazardous Condition (22.9%), Fire (22.2%), and Rescue & EMS (20.7%).
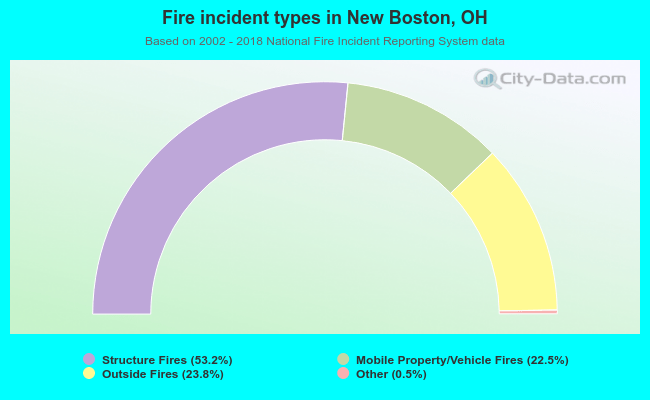 When looking into fire subcategories, the most incidents belonged to: Structure Fires (53.2%), and Outside Fires (23.8%).