| Fire incidents reported |
|---|
| Sreet name | Count |
|---|
| PINEHURST RD | 44 | | MAIN ST | 32 | | BRYNMORE RD | 22 | | COOKSTOWN-NEW EGYPT RD | 22 | | ARCHERTOWN RD | 16 | | BRINDLETOWN RD | 16 | | HOPKINS RD | 14 | | LAKEWOOD RD | 14 | | MILLSTREAM RD | 14 | | MONMOUTH RD | 14 | | EVERGREEN RD | 12 | | HIGHBRIDGE RD | 12 | | HOPKINS LN | 12 | | MAPLE AVE | 12 | | SUCCESS RD | 12 | | CIRCLE DR | 10 | | PROVINCELINE RD | 10 | | APPLEGATE LN | 8 | | LONGSWAMP RD | 8 | | BOBBIES TER | 6 | | BOBBIS TER | 6 | | CEDAR ST | 6 | | HAWKIN RD | 6 | | RT 539 | 6 | | WOODSIDE DR | 6 |
| | | Fire incidents reported |
|---|
| Sreet name | Count |
|---|
| APPLEGATE LANE | 4 | | HIGHBRIDGE RD | 4 | | JACOBSTOWN NEW EGYPT RD | 4 | | JACOBSTOWN RD | 4 | | JENNIFER WAY | 4 | | JONESMILL RD | 4 | | KUZYK RD | 4 | | LAUREL WOODS DR | 4 | | LAURELWOODS DR | 4 | | LAUREN LANE | 4 | | MAIN / PLUM ST | 4 | | MARIA DR | 4 | | MEANY RD | 4 | | PLUMRIDGE DR | 4 | | ROUTE 528 | 4 | | ROUTE 539 | 4 | | SEFEL AVE | 4 | | STORY ST | 4 | | TOWER RD | 4 | | 38 SANDERS LANE | 2 | | 528 RT | 2 | | 99 BRYNMORE RD | 2 | | APPLEGATE LANE | 2 | | APPLEGATE ROAD | 2 | | |
|
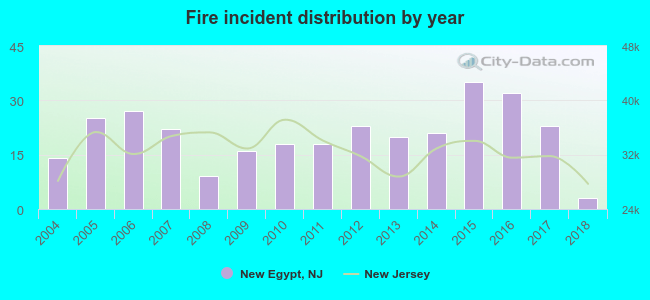 Based on the data from the years 2004 - 2018 the average number of fires per year is 20. The highest number of reported fires - 35 took place in 2015, and the least - 3 in 2018. The data has a decreasing trend.
 39.1% incidents where reported in the morning and 60.9% in the evening. The most fires (20.8%) took place on Saturday, and the least (8.1%) on Wednesday.
 According to the 307 reports from years 2004 - 2018 most fires (12.4%) took place during February, and the least (4.6%) in September.
 Out of all 1,719 cases reported during the years 2004 - 2018, the most belonged to the categories: Hazardous Condition (36.8%), Rescue & EMS (18.4%), and Fire (17.9%).
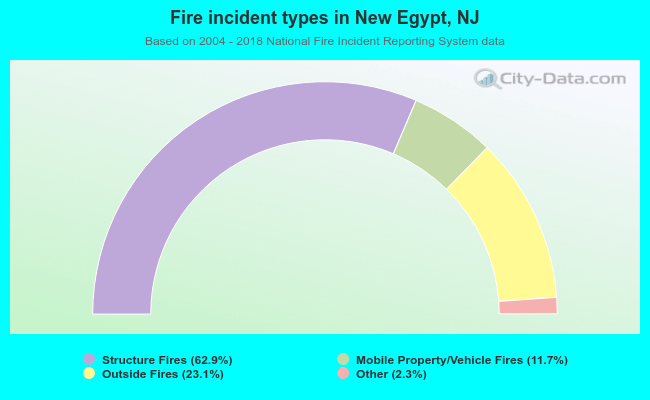 When looking into fire subcategories, the most incidents belonged to: Structure Fires (62.9%), and Outside Fires (23.1%).