New Florence: Fire Incidents, Pennsylvania (PA)
Where are fire incidents reported in New Florence, PA
Something went wrong! Please refresh the page.
|
| |||||||||||||||||||||||||||||||||||||||||||||||||||||||||||||||||||||||||||||||||||||||||||||||||||||||||||||
2005 - 2018 National Fire Incident Reporting System (NFIRS) incidents
- Incident types reported to NFIRS in New Florence, PA
- 13633.5%Fire
- 9122.4%Hazardous Condition
- 6014.8%Rescue & EMS
- 4711.6%Good Intent Call
- 348.4%Service Call
- 184.4%False Alarm
- 112.7%Severe Weather
- 82.0%Special Incident
- 10.2%Overpressure Rupture
- Fire incident types reported to NFIRS in New Florence, PA
- 7353.7%Structure Fires
- 3324.3%Outside Fires
- 1712.5%Mobile Property/Vehicle Fires
- 139.6%Other
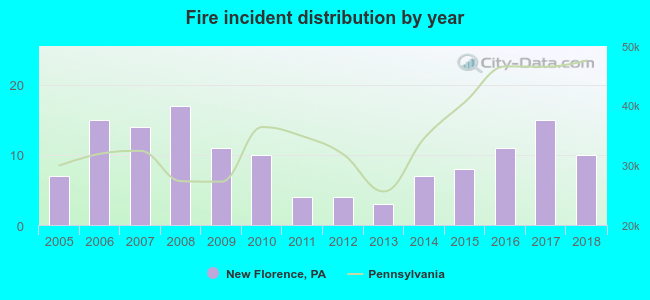 Based on the data from the years 2005 - 2018 the average number of fires per year is 10. The highest number of reported fires - 17 took place in 2008, and the least - 3 in 2013. The data has a rising trend.
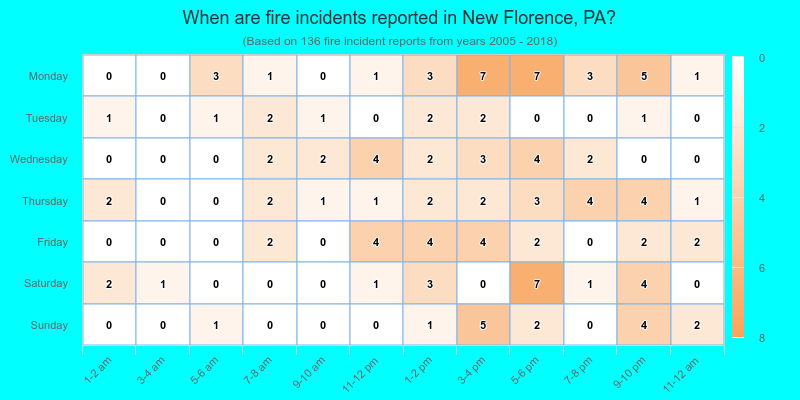
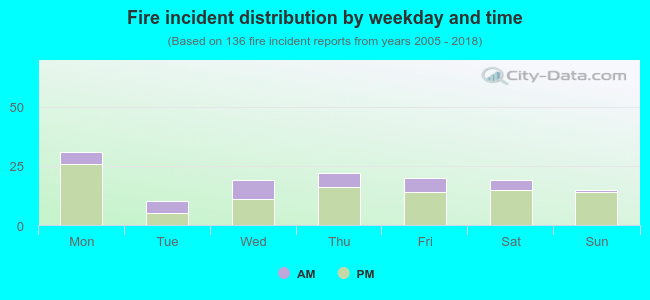 25.7% incidents where reported in the morning and 74.3% in the evening. The most fires (22.8%) took place on Monday, and the least (7.4%) on Tuesday.
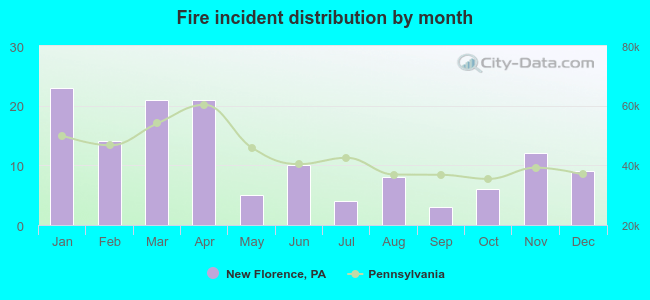 According to the 136 reports from years 2005 - 2018 most fires (16.9%) took place during January, and the least (2.2%) in September.
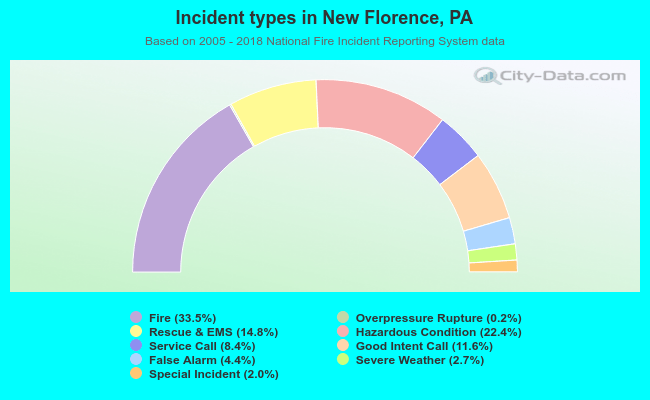 Out of all 406 cases reported during the years 2005 - 2018, the most belonged to the categories: Fire (33.5%), Hazardous Condition (22.4%), and Rescue & EMS (14.8%).
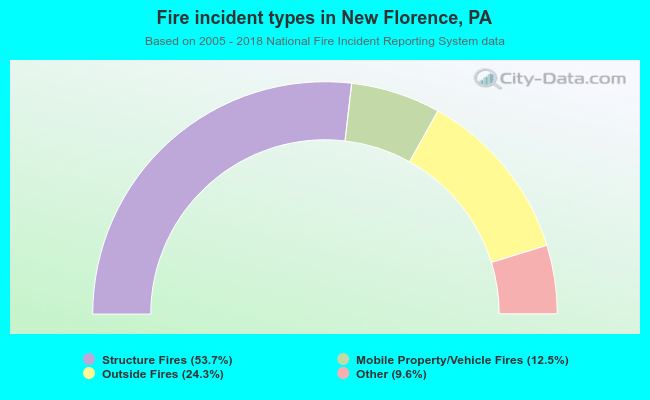 When looking into fire subcategories, the most reports belonged to: Structure Fires (53.7%), and Outside Fires (24.3%).