New Hampton: Fire Incidents, Iowa (IA)
Where are fire incidents reported in New Hampton, IA
Something went wrong! Please refresh the page.
|
| |||||||||||||||||||||||||||||||||||||||||||||||||||||||||||||||||||||||||||||||||||||||||||||||||||||||||||||
2003 - 2018 National Fire Incident Reporting System (NFIRS) incidents
- Incident types reported to NFIRS in New Hampton, IA
- 25453.4%Fire
- 6814.3%Rescue & EMS
- 5912.4%Hazardous Condition
- 326.7%False Alarm
- 255.3%Severe Weather
- 204.2%Good Intent Call
- 132.7%Service Call
- 30.6%Overpressure Rupture
- 20.4%Special Incident
- Fire incident types reported to NFIRS in New Hampton, IA
- 8834.6%Outside Fires
- 7830.7%Structure Fires
- 5120.1%Other
- 3714.6%Mobile Property/Vehicle Fires
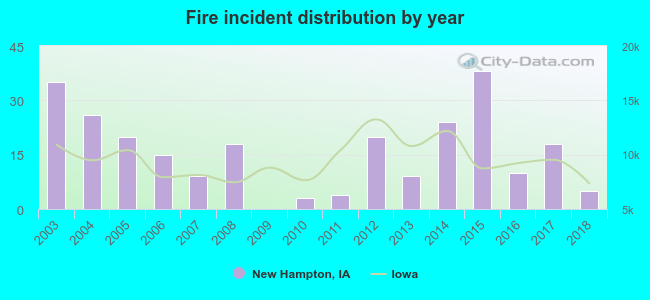 According to the data from the years 2003 - 2018 the average number of fires per year is 16. The highest number of fires - 38 took place in 2015, and the least - 0 in 2009. The data has a decreasing trend.
 31.1% incidents where reported in the morning and 68.9% in the evening. The most fires (16.5%) took place on Tuesday, and the least (10.2%) on Thursday.
 According to the 254 fire incidents from years 2003 - 2018 most fires (16.5%) took place during April, and the least (4.3%) in May.
 Out of all 476 cases reported during the years 2003 - 2018, the most belonged to the categories: Fire (53.4%), Rescue & EMS (14.3%), and Hazardous Condition (12.4%).
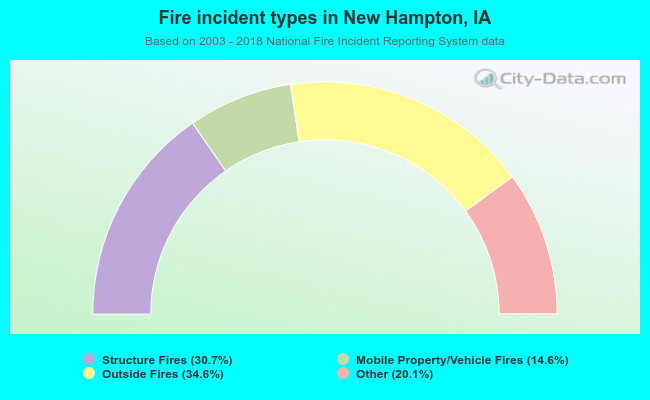 When looking into fire subcategories, the most reports belonged to: Outside Fires (34.6%), and Structure Fires (30.7%).