| Fire incidents reported |
|---|
| Sreet name | Count |
|---|
| ETHAN ALLEN HIGHWAY | 14 | | ETHAN ALLEN HWY | 10 | | DOG TEAM RD | 8 | | DANIELS RD | 6 | | ETHAN ALLEN HWY | 6 | | HALPIN RD | 6 | | NORTH ST | 6 | | 1849 NORTH ST | 4 | | 3274 ETHAN ALLEN HIGHWAY | 4 | | DOG TEAM RD | 4 | | HUNT ROAD | 4 | | MOUNTAIN VIEW RIDGE | 4 | | NORTH STREET | 4 | | SAWYER RD | 4 | | SOUTH STREET | 4 | | TOWN HILL RD | 4 | | 1001 EAST STRE | 2 | | 1329 DOG TEAM RD | 2 | | 1329 DOG TEAM ROAD | 2 | | 1341 ETHAN ALLEN HIGHWAY | 2 | | 135 NORTH STREET | 2 | | 17 EAST ST | 2 | | 1779 SOUTH ST | 2 | | 1779 SOUTH STREET | 2 | | 1919 SOUTH STREET | 2 |
| | | Fire incidents reported |
|---|
| Sreet name | Count |
|---|
| 2075 PLAMK ROAD | 2 | | 2075 PLANK ROAD | 2 | | 2180 MAIN STREET | 2 | | 2245 MAIN ST | 2 | | 2245 MAIN STREET NEW HAVEN | 2 | | 295 SOUTH STREET | 2 | | 298 MAIN STREET ST | 2 | | 309 MAIN STREET | 2 | | 3103 NORTH ST | 2 | | 3512 MUNGER STRE | 2 | | 3521 ETHAN ALLEN HWY | 2 | | 3557 ETHAN ALLEN HIGHWAY | 2 | | 359 SOUTH STREET | 2 | | 368 MEADOW LANE | 2 | | 402 BELDEN RD | 2 | | 402 BELDON RD | 2 | | 445 CAMPGROUND ROAD | 2 | | 446 WILD APPLE RD | 2 | | 4715 MUNGER STREET | 2 | | 50 NORTH STREET | 2 | | 5341 MUNGER STREET | 2 | | 535 DANIELS RD | 2 | | 5840 ETHAN ALLEN HIGHWAY | 2 | | 5840 ETHAN ALLEN HWY | 2 | | 601 SAWYER ROAD | 2 |
|
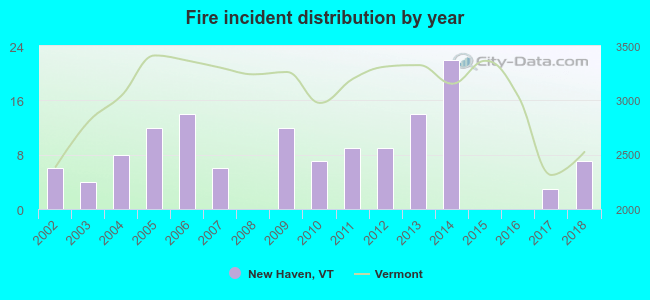 Based on the data from the years 2002 - 2018 the average number of fires per year is 8. The highest number of reported fires - 22 took place in 2014, and the least - 0 in 2008. The data has an increasing trend.
 44.4% incidents where reported in the morning and 55.6% in the evening. The most fires (18.0%) took place on Thursday, and the least (12.0%) on Monday.
 Based on the 133 fires from years 2002 - 2018 most fires (14.3%) took place during September, and the least (4.5%) in December.
 Out of all 295 cases reported during the years 2002 - 2018, the most belonged to the categories: Fire (45.1%), Rescue & EMS (22.0%), and Overpressure Rupture (21.7%).
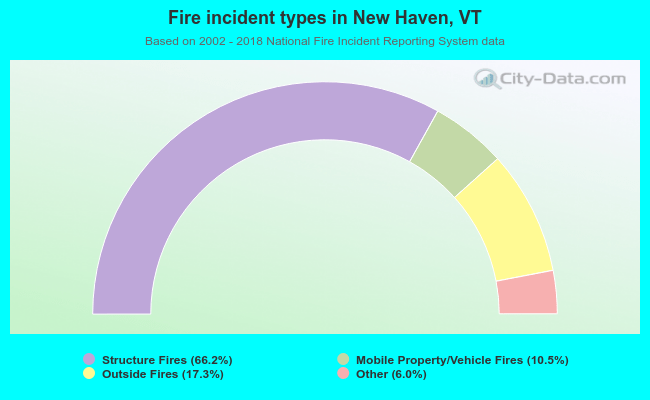 When looking into fire subcategories, the most reports belonged to: Structure Fires (66.2%), and Outside Fires (17.3%).