New Hope: Fire Incidents, Pennsylvania (PA)
Where are fire incidents reported in New Hope, PA
Something went wrong! Please refresh the page.
|
| |||||||||||||||||||||||||||||||||||||||||||||||||||||||||||||||||||||||||||||||||||||||||||||||||||||||||||||
2003 - 2018 National Fire Incident Reporting System (NFIRS) incidents
- Incident types reported to NFIRS in New Hope, PA
- 27230.0%False Alarm
- 18420.3%Fire
- 17619.4%Hazardous Condition
- 11913.1%Rescue & EMS
- 11512.7%Good Intent Call
- 374.1%Service Call
- 10.1%Overpressure Rupture
- 10.1%Severe Weather
- 10.1%Special Incident
- Fire incident types reported to NFIRS in New Hope, PA
- 14076.1%Structure Fires
- 3820.7%Outside Fires
- 31.6%Mobile Property/Vehicle Fires
- 31.6%Other
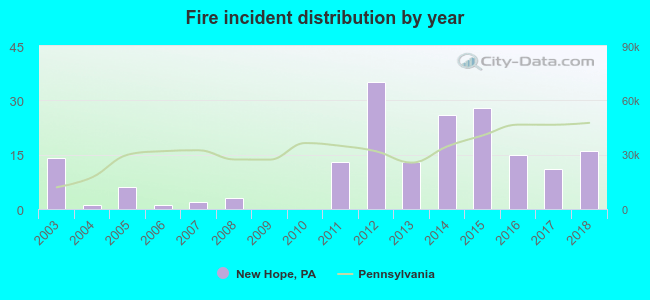 Based on the data from the years 2003 - 2018 the average number of fires per year is 12. The highest number of reported fires - 35 took place in 2012, and the least - 0 in 2009. The data has a rising trend.
 41.3% incidents where reported in the morning and 58.7% in the evening. The most fires (16.3%) took place on Monday, and the least (12.0%) on Saturday.
 According to the 184 reports from years 2003 - 2018 most fires (19.0%) took place during February, and the least (3.8%) in October.
 Out of all 906 cases reported during the years 2003 - 2018, the most belonged to the categories: False Alarm (30.0%), Fire (20.3%), and Hazardous Condition (19.4%).
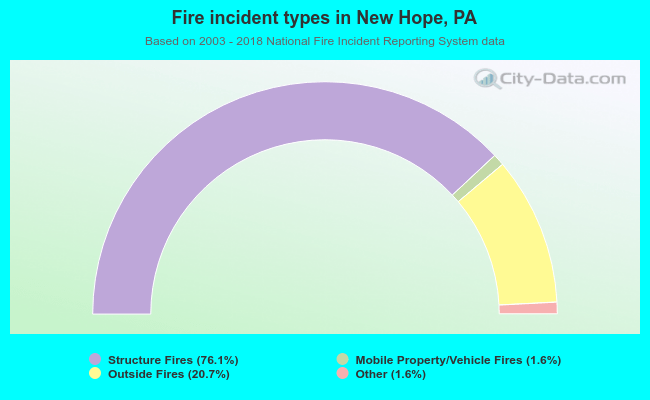 When looking into fire subcategories, the most reports belonged to: Structure Fires (76.1%), and Outside Fires (20.7%).