New Llano: Fire Incidents, Louisiana (LA)
Where are fire incidents reported in New Llano, LA
Something went wrong! Please refresh the page.
|
| |||||||||||||||||||||||||||||||||||||||||||||||||||||||||||||||||||||||||||||||||||||||||||||||||||||||||||||
2002 - 2018 National Fire Incident Reporting System (NFIRS) incidents
- Incident types reported to NFIRS in New Llano, LA
- 57943.0%Rescue & EMS
- 42931.9%Service Call
- 13610.1%Fire
- 745.5%Hazardous Condition
- 695.1%Good Intent Call
- 372.7%False Alarm
- 131.0%Severe Weather
- 90.7%Special Incident
- Fire incident types reported to NFIRS in New Llano, LA
- 7152.2%Outside Fires
- 4936.0%Structure Fires
- 1611.8%Mobile Property/Vehicle Fires
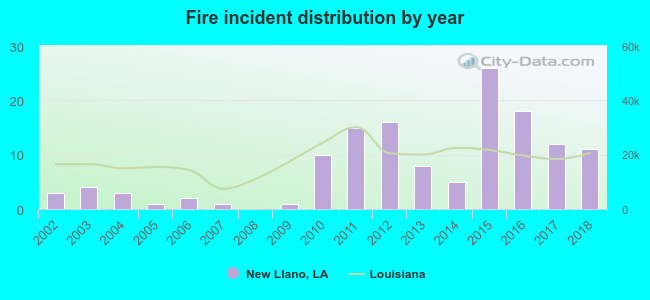 According to the data from the years 2002 - 2018 the average number of fires per year is 8. The highest number of fires - 26 took place in 2015, and the least - 0 in 2008. The data has an increasing trend.
 25.7% incidents where reported in the morning and 74.3% in the evening. The most fires (18.4%) took place on Thursday, and the least (8.8%) on Saturday.
 According to the 136 fires from years 2002 - 2018 most fires (13.2%) took place during May, and the least (3.7%) in December.
 Out of all 1,346 cases reported during the years 2002 - 2018, the most belonged to the categories: Overpressure Rupture (43.0%), Hazardous Condition (31.9%), and Fire (10.1%).
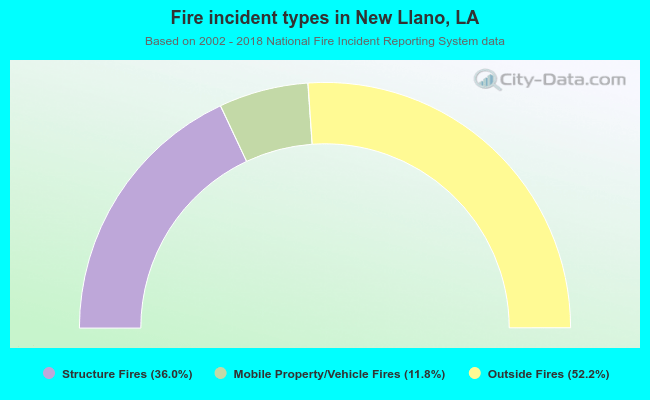 When looking into fire subcategories, the most incidents belonged to: Outside Fires (52.2%), and Structure Fires (36.0%).