New London: Fire Incidents, Iowa (IA)
Where are fire incidents reported in New London, IA
Something went wrong! Please refresh the page.
|
| |||||||||||||||||||||||||||||||||||||||||||||||||||||||||||||||||||||||||||||||||||||||||||||||||||||||||||||
2002 - 2018 National Fire Incident Reporting System (NFIRS) incidents
- Incident types reported to NFIRS in New London, IA
- 68767.8%Rescue & EMS
- 18318.0%Fire
- 494.8%Good Intent Call
- 373.6%Hazardous Condition
- 242.4%Service Call
- 202.0%False Alarm
- 70.7%Special Incident
- 60.6%Severe Weather
- Fire incident types reported to NFIRS in New London, IA
- 8144.3%Outside Fires
- 6133.3%Structure Fires
- 3217.5%Mobile Property/Vehicle Fires
- 94.9%Other
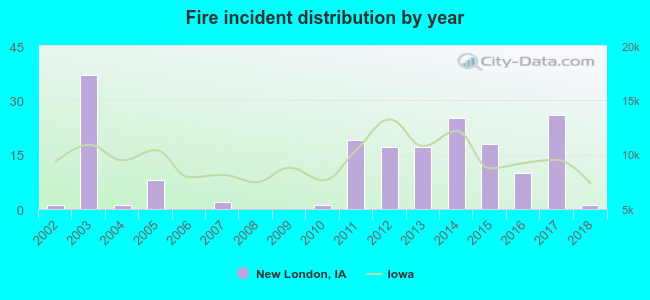 Based on the data from the years 2002 - 2018 the average number of fire incidents per year is 11. The highest number of fire incidents - 37 took place in 2003, and the least - 0 in 2006. The data has a constant trend.
 30.1% incidents where reported in the morning and 69.9% in the evening. The most fires (19.1%) took place on Saturday, and the least (10.9%) on Tuesday.
 Based on the 183 incident reports from years 2002 - 2018 most fires (17.5%) took place during April, and the least (4.4%) in September.
 Out of all 1,014 cases reported during the years 2002 - 2018, the most belonged to the categories: Rescue & EMS (67.8%), Fire (18.0%), and Good Intent Call (4.8%).
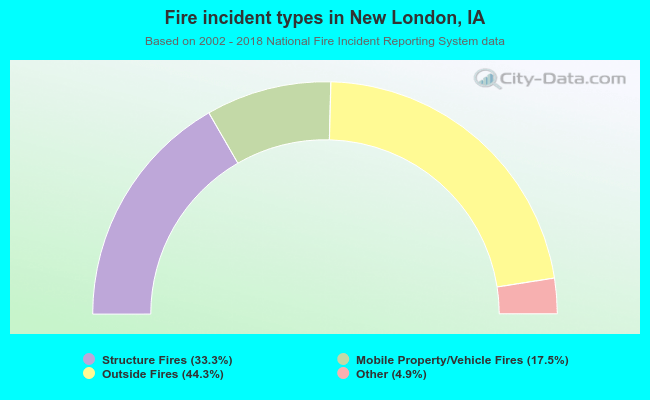 When looking into fire subcategories, the most reports belonged to: Outside Fires (44.3%), and Structure Fires (33.3%).