| Fire incidents reported |
|---|
| Sreet name | Count |
|---|
| US 61 HWY | 10 | | 62325 OAK HILL RD | 8 | | 12256 NEW LONDON GRAVEL RD | 6 | | 12600 ORCHARD AVE | 6 | | 58480 FLINT HILL RD | 6 | | MAIN | 6 | | OAK HILL RD | 6 | | RT A | 6 | | 12707 CHEROKEE TRL | 4 | | 13408 CODY DR | 4 | | 13786 RIVERVIEW DR | 4 | | 14032 CRANE HOLLER PL | 4 | | 15335 WHIPPOORWILL HL | 4 | | 1ST ST | 4 | | 53600 EAGLE RIDGE TRL | 4 | | 55335 TRABUE LN | 4 | | 55969 TRABUE LN | 4 | | CHEROKEE DR | 4 | | HENRY DR | 4 | | HIGHWAY 61 | 4 | | HIGHWAY A | 4 | | HWY 79 | 4 | | HWY A | 4 | | MAIN ST | 4 | | MALARUNI RD | 4 |
| | | Fire incidents reported |
|---|
| Sreet name | Count |
|---|
| MO 79 HWY | 4 | | OLD 79 HWY | 4 | | ROUTE O HWY | 4 | | RT F | 4 | | 1 MILE S OF NL ON 61 | 2 | | 100 EAST FIRST ST. | 2 | | 100 N MAIN STRE | 2 | | 101 NORTH MAIN ST | 2 | | 10949 NEW LONDON GRAVEL RD | 2 | | 11250 OLD 79 HWY | 2 | | 11391 RUSK TRL | 2 | | 11565 SIOUX DR | 2 | | 11589 OLD 79 HWY | 2 | | 12037 OLD 79 HWY | 2 | | 12355 OLD 79 HWY | 2 | | 12367 STABLE DR | 2 | | 12418 SAVERTON DR | 2 | | 12428 CHEROKEE DR | 2 | | 12451 STABLE DR | 2 | | 12455 NEW LONDON GRAVEL RD | 2 | | 12534 HIGHWAY O | 2 | | 12600 ORCHARD RD | 2 | | 12681 HEAVENLY ACRES DR | 2 | | 12686 THORNBERRY RD | 2 | | |
|
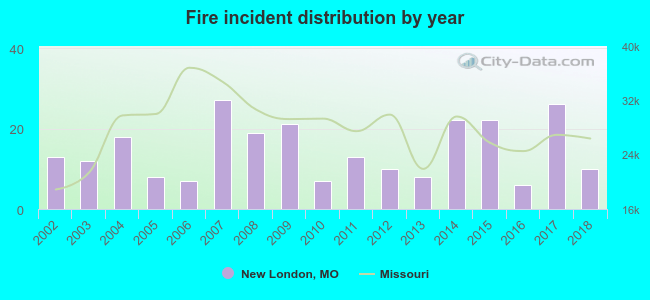 According to the data from the years 2002 - 2018 the average number of fire incidents per year is 15. The highest number of fires - 27 took place in 2007, and the least - 6 in 2016. The data has a declining trend.
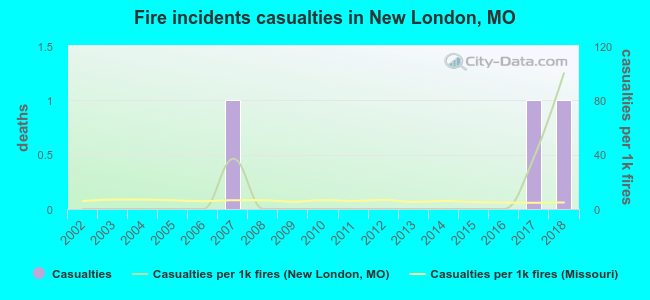 According to the data from the years 2002 - 2018 the average number of fire-related casualties per year is 0. The highest number of reported casualties - 1 took place in 2007, and the lowest - 0 in 2002. The data has a rising trend.
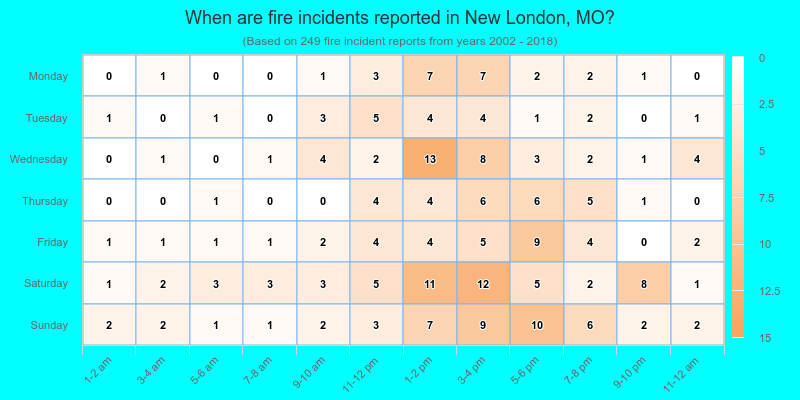
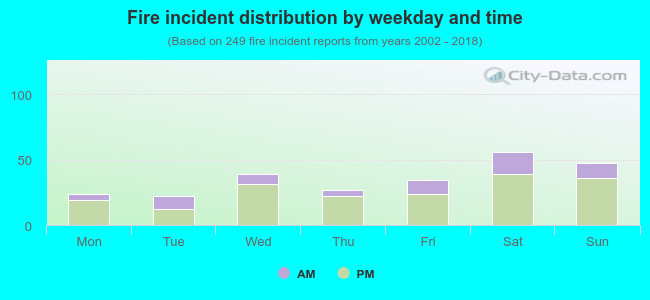 26.5% incidents where reported in the morning and 73.5% in the evening. The most fires (22.5%) took place on Saturday, and the least (8.8%) on Tuesday.
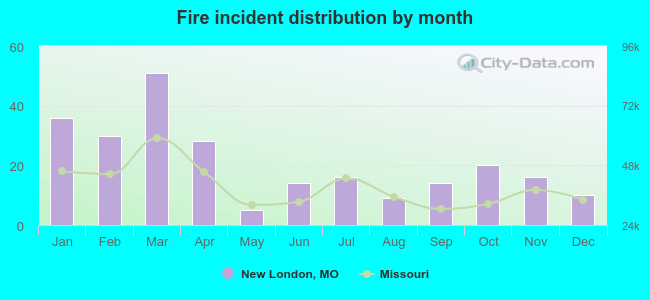 Based on the 249 fire incidents from years 2002 - 2018 most fires (20.5%) took place during March, and the least (2.0%) in May.
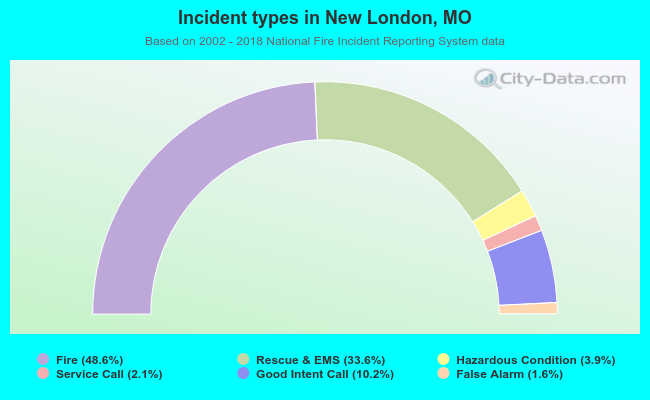 Out of all 512 cases reported during the years 2002 - 2018, the most belonged to the categories: Fire (48.6%), Overpressure Rupture (33.6%), and Service Call (10.2%).
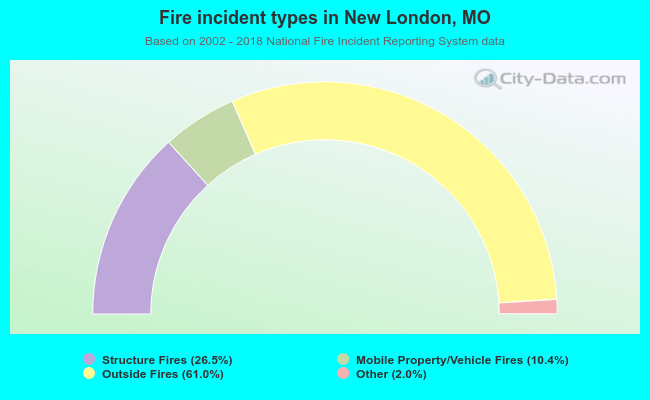 When looking into fire subcategories, the most reports belonged to: Outside Fires (61.0%), and Structure Fires (26.5%).