| Fire incidents reported |
|---|
| Sreet name | Count |
|---|
| YORK ROAD | 70 | | OXFORD ROAD | 56 | | CARLISLE PIKE | 52 | | LINCOLNWAY EAST | 24 | | NEW CHESTER ROAD | 22 | | HANOVER STREET | 18 | | BERLIN ROAD | 14 | | HUNTERSTOWNHAMPTON ROAD | 14 | | KOHLER MILL ROAD | 14 | | YORK RD | 14 | | FLESHMAN MILL ROAD | 12 | | LINCOLNWAY WEST | 12 | | SWIFT RUN ROAD | 12 | | BRICKCRAFTERS ROAD | 10 | | IRISHTOWN ROAD | 10 | | NORTH BOLTON STREET | 10 | | WEST HIGH STREET | 10 | | 700 ROAD | 8 | | BROWNS DAM ROAD | 8 | | CARLISLE PIKE | 8 | | EAST LOCUST LANE | 8 | | GREEN RIDGE ROAD | 8 | | SPRINGFIELD DRIVE | 8 | | BEAVER RUN ROAD | 6 | | BERLIN RD | 6 |
| | | Fire incidents reported |
|---|
| Sreet name | Count |
|---|
| BRICKYARD ROAD | 6 | | CARLISLE STREET | 6 | | CEDAR ROAD | 6 | | COMMERCE STREET | 6 | | DICK'S DAM ROAD | 6 | | GOOSEVILLE ROAD | 6 | | JACQUELINE DRIVE | 6 | | MOUNT MISERY ROAD | 6 | | OLD MILL ROAD | 6 | | OXFORD RD | 6 | | PLUM RUN ROAD | 6 | | RED BRIDGE ROAD | 6 | | SPRUCE LANE | 6 | | TAPEWORM RD | 6 | | BONOX ROAD | 4 | | BRICK LANE | 4 | | CHRISTOPHER LEE DRIVE | 4 | | COTTAGE LANE | 4 | | DRUMMER DRIVE | 4 | | EAST BERLIN ROAD | 4 | | EAST HIGH STREET | 4 | | ELM LANE | 4 | | ELM LN | 4 | | FAWN AVENUE | 4 | | FERN DRIVE | 4 |
|
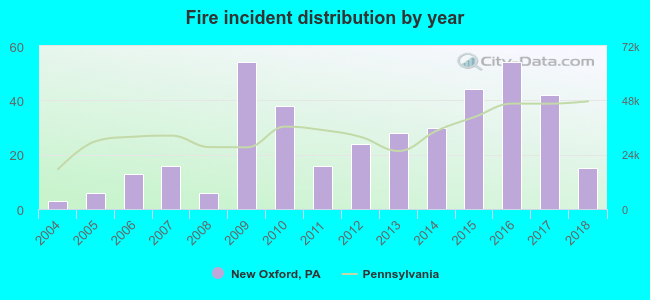 Based on the data from the years 2004 - 2018 the average number of fires per year is 26. The highest number of reported fires - 54 took place in 2009, and the least - 3 in 2004. The data has a rising trend.
 38.3% incidents where reported in the morning and 61.7% in the evening. The most fires (17.7%) took place on Sunday, and the least (11.8%) on Wednesday.
 According to the 389 reports from years 2004 - 2018 most fires (13.1%) took place during January, and the least (4.4%) in October.
 Out of all 1,553 cases reported during the years 2004 - 2018, the most belonged to the categories: Rescue & EMS (26.1%), Fire (25.0%), and Good Intent Call (16.4%).
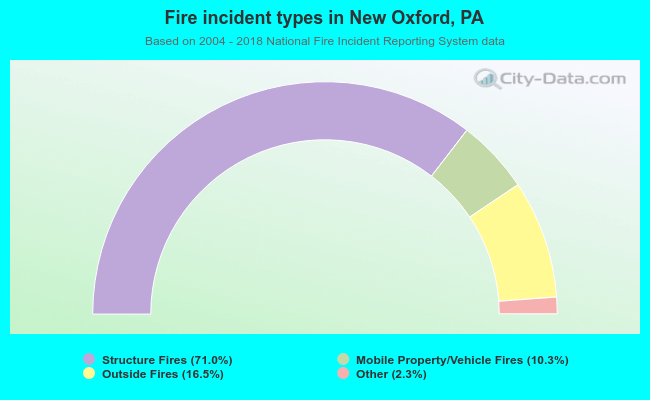 When looking into fire subcategories, the most reports belonged to: Structure Fires (71.0%), and Outside Fires (16.5%).