New Ross: Fire Incidents, Indiana (IN)
Where are fire incidents reported in New Ross, IN
Something went wrong! Please refresh the page.
|
| |||||||||||||||||||||||||||||||||||||||||||||||||||||||||||||||||||||||||||||||||||||||||||||||||||||||||||||
| Other | 9 | |||||||||||||||||||||||||||||||||||||||||||||||||||||||||||||||||||||||||||||||||||||||||||||||||||||||||||||
2002 - 2018 National Fire Incident Reporting System (NFIRS) incidents
- Incident types reported to NFIRS in New Ross, IN
- 15551.8%Fire
- 9030.1%Rescue & EMS
- 217.0%Hazardous Condition
- 206.7%Good Intent Call
- 41.3%Service Call
- 41.3%Special Incident
- 31.0%False Alarm
- 20.7%Severe Weather
- Fire incident types reported to NFIRS in New Ross, IN
- 8051.6%Outside Fires
- 4730.3%Structure Fires
- 1912.3%Mobile Property/Vehicle Fires
- 95.8%Other
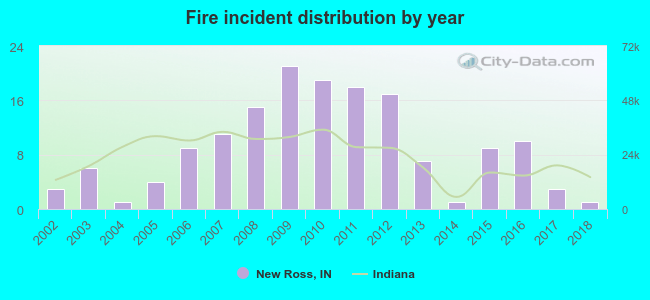 Based on the data from the years 2002 - 2018 the average number of fire incidents per year is 9. The highest number of reported fire incidents - 21 took place in 2009, and the least - 1 in 2004. The data has a dropping trend.
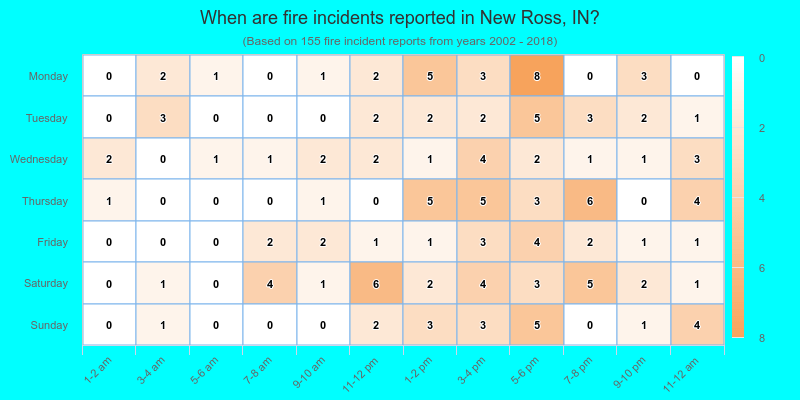
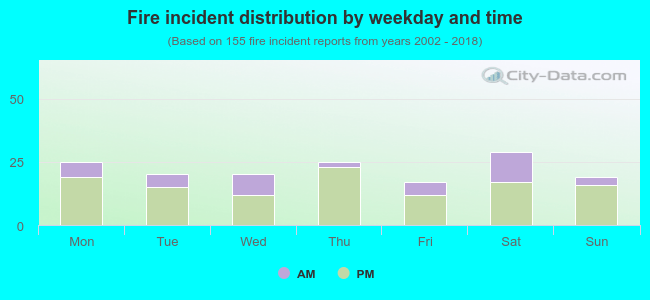 26.5% incidents where reported in the morning and 73.5% in the evening. The most fires (18.7%) took place on Saturday, and the least (11.0%) on Friday.
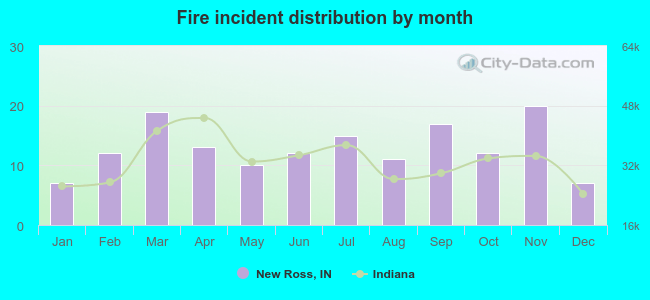 According to the 155 reports from years 2002 - 2018 most fires (12.9%) took place during November, and the least (4.5%) in January.
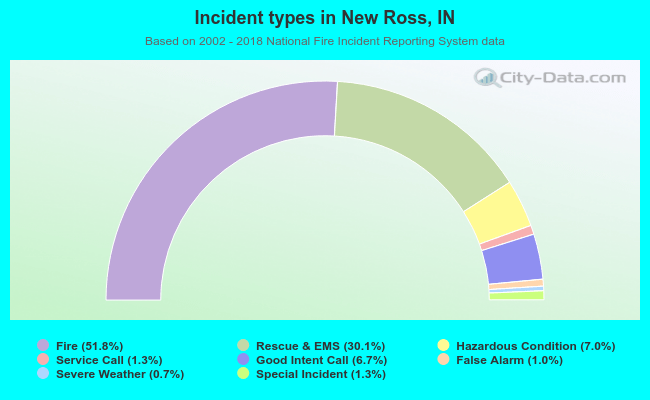 Out of all 299 cases reported during the years 2002 - 2018, the most belonged to the categories: Fire (51.8%), Overpressure Rupture (30.1%), and Rescue & EMS (7.0%).
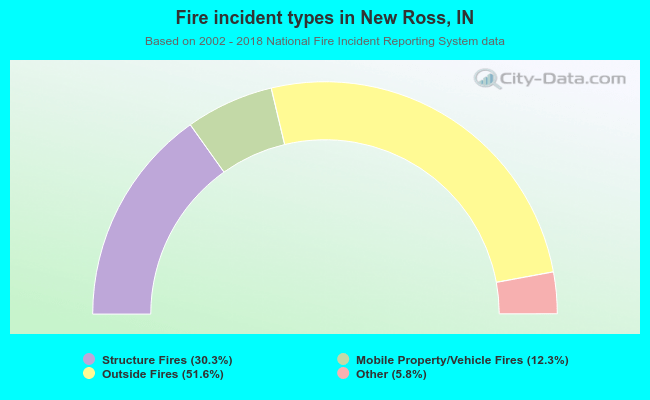 When looking into fire subcategories, the most incidents belonged to: Outside Fires (51.6%), and Structure Fires (30.3%).