New Salem: Fire Incidents, North Dakota (ND)
Where are fire incidents reported in New Salem, ND
Something went wrong! Please refresh the page.
|
| |||||||||||||||||||||||||||||||||||||||||||||||||||||||||||||||||||||||||||||||||||||||||||||||||||||||||||||
| Other | 154 | |||||||||||||||||||||||||||||||||||||||||||||||||||||||||||||||||||||||||||||||||||||||||||||||||||||||||||||
2002 - 2018 National Fire Incident Reporting System (NFIRS) incidents
- Incident types reported to NFIRS in New Salem, ND
- 35275.4%Fire
- 5311.3%Rescue & EMS
- 214.5%Hazardous Condition
- 214.5%Good Intent Call
- 81.7%Service Call
- 40.9%Severe Weather
- 40.9%Special Incident
- 30.6%False Alarm
- 10.2%Overpressure Rupture
- Fire incident types reported to NFIRS in New Salem, ND
- 23265.9%Outside Fires
- 7019.9%Mobile Property/Vehicle Fires
- 359.9%Structure Fires
- 154.3%Other
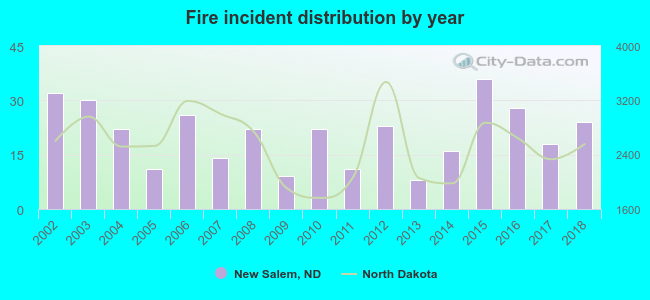 According to the data from the years 2002 - 2018 the average number of fires per year is 21. The highest number of reported fire incidents - 36 took place in 2015, and the least - 8 in 2013. The data has a decreasing trend.
 24.7% incidents where reported in the morning and 75.3% in the evening. The most fires (19.0%) took place on Wednesday, and the least (9.4%) on Tuesday.
 According to the 352 fire incidents from years 2002 - 2018 most fires (17.3%) took place during July, and the least (1.7%) in January.
 Out of all 467 cases reported during the years 2002 - 2018, the most belonged to the categories: Fire (75.4%), Rescue & EMS (11.3%), and Hazardous Condition (4.5%).
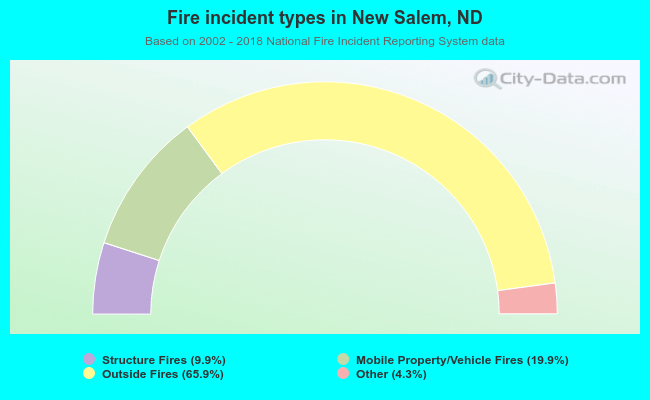 When looking into fire subcategories, the most reports belonged to: Outside Fires (65.9%), and Mobile Property/Vehicle Fires (19.9%).