| Fire incidents reported |
|---|
| Sreet name | Count |
|---|
| PENNSYLVANIA TPKE | 72 | | CUMBERLAND HWY | 48 | | NEWBURG RD | 46 | | MOUNTAIN RD | 30 | | ENOLA RD | 22 | | CUMBERLAND1501217899 HWY | 18 | | OAK BEND RD | 14 | | QUIGLEY RD | 14 | | RIDGE RD | 14 | | ROXBURY RD | 14 | | TURNPIKE RD | 14 | | GREENSPRING RD | 12 | | PA TURNPIKE | 12 | | CREEK RD | 10 | | MOUNTAIN LN | 10 | | THREE SQUARE HOLLOW RD | 10 | | BOOZ RD | 8 | | CLAY HILL RD | 8 | | NEWBURG (7700-8999) RD | 8 | | SHADY RD | 8 | | SHIPPENSBURG RD | 8 | | UPPER STRASBURG RD | 8 | | CUMBERLAND (15012-17899) HWY | 6 | | FAIRVIEW RD | 6 | | HASSINGER RD | 6 |
| | | Fire incidents reported |
|---|
| Sreet name | Count |
|---|
| LINDSEY LOT RD | 6 | | MCCLAYS MILL RD | 6 | | MOWERSVILLE (09389-15299) RD | 6 | | NEWBURG825110450 RD | 6 | | OLD SCOTLAND RD | 6 | | ORRSTOWN RD | 6 | | OTTERBEIN CHURCH RD | 6 | | OTTERBEIN SCH 900011299 RD | 6 | | PA TURNPIKE TPKE | 6 | | PENNSYLVANIA TURNPIKE TPKE | 6 | | RITNER HWY | 6 | | SECOND ST | 6 | | VAUGHN RD | 6 | | BRIDEWATER LN | 4 | | CHAMBERLIN RD | 4 | | CUMBERLAND HIGHWAY HWY | 4 | | CUMBERLAND HY | 4 | | EAST CREEK RD | 4 | | ETTER RD | 4 | | FISH HATCHERY RD | 4 | | FORGE HILL RD | 4 | | GAMELAND RD | 4 | | HERSHEY RD | 4 | | HIGH ST | 4 | | |
|
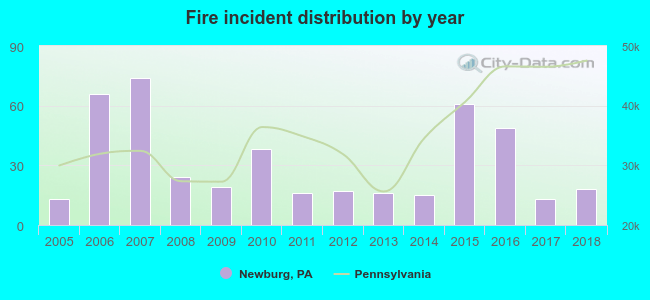 According to the data from the years 2005 - 2018 the average number of fires per year is 31. The highest number of reported fire incidents - 74 took place in 2007, and the least - 13 in 2005. The data has a rising trend.
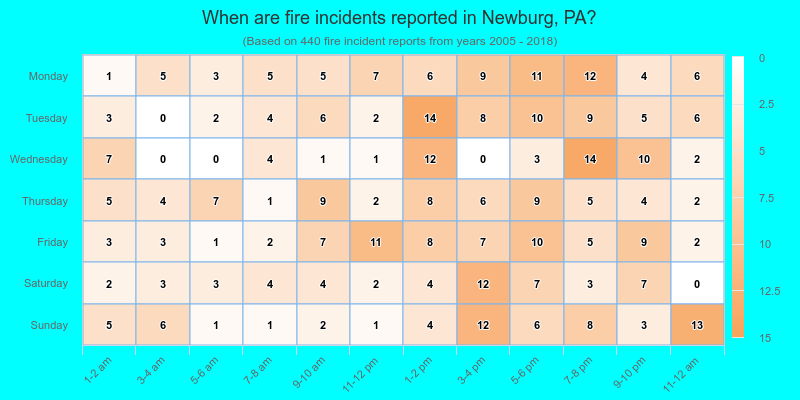
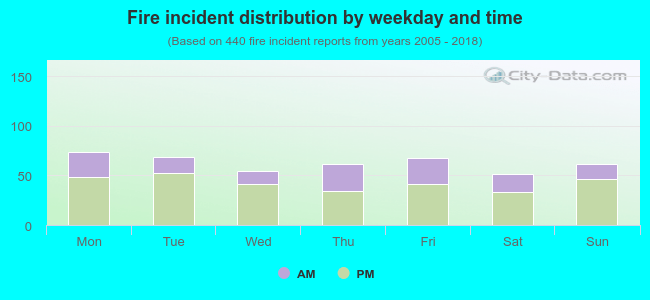 33.0% incidents where reported in the morning and 67.0% in the evening. The most fires (16.8%) took place on Monday, and the least (11.6%) on Saturday.
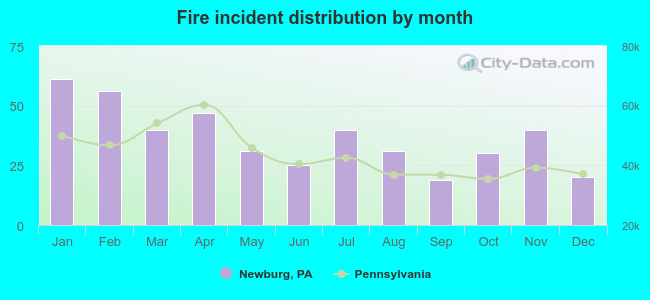 Based on the 440 fire incidents from years 2005 - 2018 most fires (13.9%) took place during January, and the least (4.3%) in September.
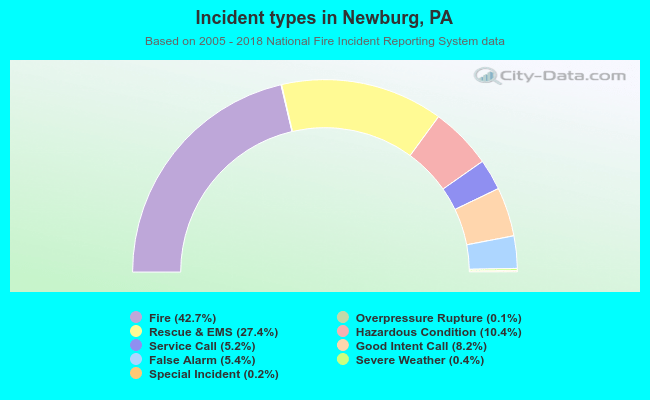 Out of all 1,031 cases reported during the years 2005 - 2018, the most belonged to the categories: Fire (42.7%), Rescue & EMS (27.4%), and Hazardous Condition (10.4%).
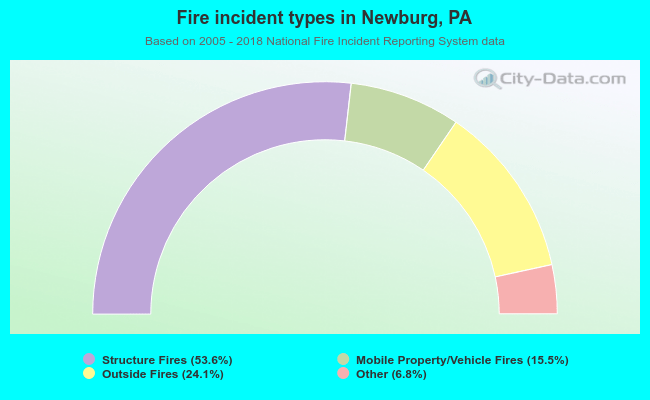 When looking into fire subcategories, the most reports belonged to: Structure Fires (53.6%), and Outside Fires (24.1%).