| Fire incidents reported |
|---|
| Sreet name | Count |
|---|
| I80 | 54 | | RATTLESNAKE RD | 34 | | NEWCASTLE RD | 24 | | ROCK SPRINGS RD | 24 | | RIDGE RD | 22 | | GILARDI RD | 12 | | GOLD HILL RD | 10 | | OAK TERRACE RD | 10 | | OLD ORCHARD LN | 10 | | SANTOS RD | 10 | | TAYLOR RD | 10 | | AUBURN FOLSOM RD | 8 | | INDIAN HILL RD | 8 | | POWERHOUSE RD | 8 | | AUBURN FOLSOM | 6 | | CHANTRY HILL RD | 6 | | HECTOR RD | 6 | | HWY 193 | 6 | | I-80 | 6 | | I80 FWY | 6 | | LINCOLN NEWCASTLE HIGHWAY | 6 | | CASTLE CREEK RANCH RD | 4 | | CHILI HILL RD | 4 | | FRUITVALE RD | 4 | | INTERSTATE 80 FWY | 4 |
| | | Fire incidents reported |
|---|
| Sreet name | Count |
|---|
| KELLOGG ST | 4 | | KENTUCKY GREENS | 4 | | LINCOLN NEWCASTLE HW | 4 | | LOS PUENTES RD | 4 | | NEWCASTLE | 4 | | NIGEL ESTATES DR | 4 | | OLD STATE HIGHWAY | 4 | | RAYFEN LN | 4 | | RIDGE ROAD | 4 | | SANTOS ROAD | 4 | | SHADY OAKS LN | 4 | | TOSCANA PL | 4 | | RD | 2 | | 180 P AND S LN | 2 | | 2751 NEWCASTLE RD | 2 | | 8155 HWY 193 HWY | 2 | | 8340 DICK COOK DRIVE | 2 | | 8881 HATHAWAY | 2 | | 9101 HWY 193 | 2 | | 980 STONEWOOD LANE | 2 | | AMBER LANE | 2 | | AMBER LN | 2 | | ANDREGG ROAD | 2 | | BARBULA HILL | 2 | | |
|
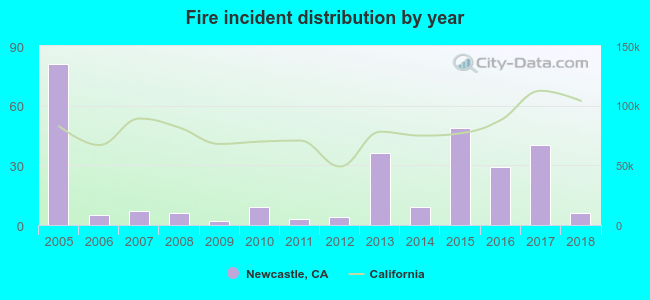 According to the data from the years 2005 - 2018 the average number of fires per year is 20. The highest number of reported fires - 81 took place in 2005, and the least - 2 in 2009. The data has a declining trend.
 28.7% incidents where reported in the morning and 71.3% in the evening. The most fires (16.8%) took place on Thursday, and the least (12.2%) on Tuesday.
 Based on the 286 incident reports from years 2005 - 2018 most fires (17.5%) took place during August, and the least (4.9%) in January.
 Out of all 1,224 cases reported during the years 2005 - 2018, the most belonged to the categories: Rescue & EMS (45.1%), Fire (23.4%), and Good Intent Call (18.4%).
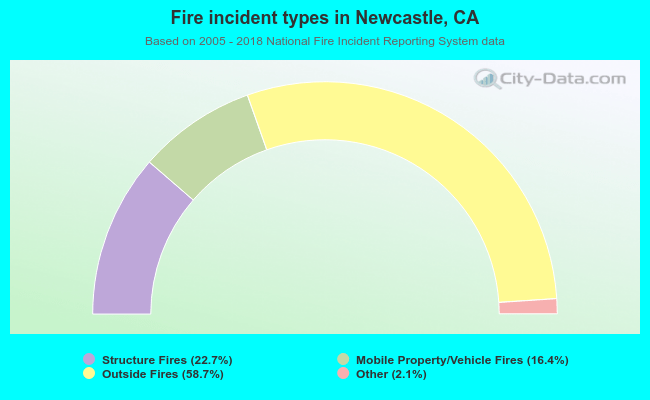 When looking into fire subcategories, the most reports belonged to: Outside Fires (58.7%), and Structure Fires (22.7%).