| Fire incidents reported |
|---|
| Sreet name | Count |
|---|
| HIGHWAY 4 HWY | 28 | | HIGHWAY 65 HWY | 22 | | VERONA ST | 22 | | HIGHWAY 605 HWY | 20 | | HIGHWAY 575 HWY | 14 | | FERRINGTON ST | 10 | | HIGHWAY 128 HWY | 10 | | HIGHWAY 608 HWY | 10 | | HIGHWAY 888 HWY | 10 | | LOMBARDO ST | 10 | | ROUTH ST | 10 | | BURNSIDE ST | 8 | | GENTRY ST | 8 | | HIGHWAY 604 HWY | 8 | | ALABAMA ST | 6 | | BAMBURG RD | 6 | | HIGHWAY 887 HWY | 6 | | SHACKLEFORD RD | 6 | | ARNOLD LOOP | 4 | | CLYDESDALE RD | 4 | | DEVRIES ST | 4 | | FULTZ ST | 4 | | HILLCREST DR | 4 | | OAK ST | 4 | | WALKER ST | 4 |
| | | Fire incidents reported |
|---|
| Sreet name | Count |
|---|
| ARKANSAS ST | 2 | | BEASLEY RD | 2 | | BELL RD | 2 | | BRYANT ST | 2 | | CIRCLE DR | 2 | | DUNN RD | 2 | | FIRST WEST ST | 2 | | HAWKINS ST | 2 | | HIGHWAY 1079 HWY | 2 | | HOGUE RD | 2 | | JACOBY ST | 2 | | LA HIGHWAY 128 HWY | 2 | | LORD RD | 2 | | MAIN ST | 2 | | MCDONALD ST | 2 | | MELTON ST | 2 | | MIDDLE RD | 2 | | MISSISSIPPI ST | 2 | | MOSSGROVE RD | 2 | | NEWELLTON CLUB RD | 2 | | NEWLIGHT RD | 2 | | PECAN ST | 2 | | POINT DR | 2 | | POPLAR ST | 2 | | |
|
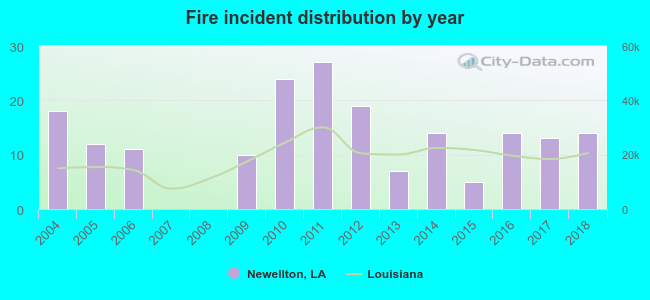 Based on the data from the years 2004 - 2018 the average number of fires per year is 13. The highest number of reported fire incidents - 27 took place in 2011, and the least - 0 in 2007. The data has a declining trend.
 28.7% incidents where reported in the morning and 71.3% in the evening. The most fires (17.6%) took place on Saturday, and the least (11.7%) on Tuesday.
 According to the 188 fires from years 2004 - 2018 most fires (12.2%) took place during January, and the least (4.8%) in February.
 Out of all 381 cases reported during the years 2004 - 2018, the most belonged to the categories: Fire (49.3%), Overpressure Rupture (35.2%), and Service Call (6.0%).
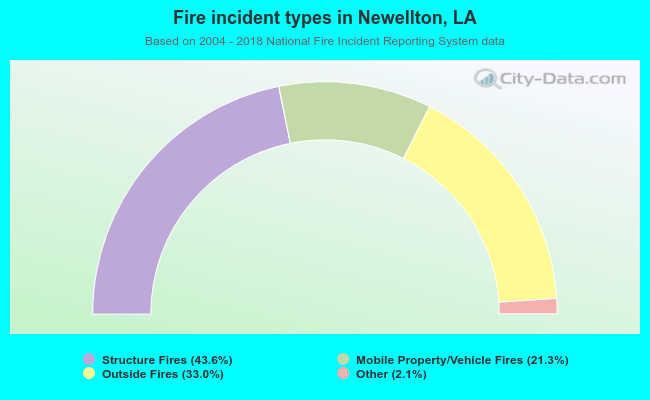 When looking into fire subcategories, the most incidents belonged to: Structure Fires (43.6%), and Outside Fires (33.0%).