Newfield: Fire Incidents, New York (NY)
Where are fire incidents reported in Newfield, NY
Something went wrong! Please refresh the page.
|
| |||||||||||||||||||||||||||||||||||||||||||||||||||||||||||||||||||||||||||||||||||||||||||||||||||||||||||||
2002 - 2018 National Fire Incident Reporting System (NFIRS) incidents
- Incident types reported to NFIRS in Newfield, NY
- 79660.9%Rescue & EMS
- 13110.0%Hazardous Condition
- 1269.6%Service Call
- 1098.3%Good Intent Call
- 1017.7%Fire
- 342.6%False Alarm
- 60.5%Severe Weather
- 30.2%Special Incident
- 20.2%Overpressure Rupture
- Fire incident types reported to NFIRS in Newfield, NY
- 5756.4%Structure Fires
- 1716.8%Outside Fires
- 1615.8%Mobile Property/Vehicle Fires
- 1110.9%Other
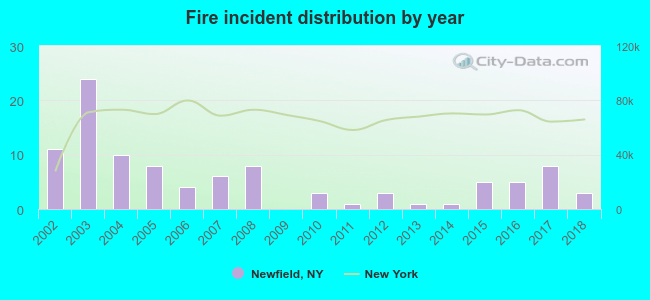 According to the data from the years 2002 - 2018 the average number of fire incidents per year is 6. The highest number of fire incidents - 24 took place in 2003, and the least - 0 in 2009. The data has a dropping trend.
The average number of yearly fire incidents per 10k residents in Newfield, NY compared to nearest cities:
(Note: Based on data for the last 3 years, including only cities with population 5,000 and above)
| Newfield: | 10.3 |
| Ithaca: | 53.4 |
| Horseheads: | 92.3 |
| Elmira: | 50.2 |
| Barton: | 7.5 |
| Big Flats: | 15.2 |
| Southport: | 2.3 |
| Cortlandville: | 20.0 |

 38.6% incidents where reported in the morning and 61.4% in the evening. The most fires (22.8%) took place on Monday, and the least (8.9%) on Friday.
 Based on the 101 fire incidents from years 2002 - 2018 most fires (12.9%) took place during January, and the least (1.0%) in August.
 Out of all 1,308 cases reported during the years 2002 - 2018, the most belonged to the categories: Rescue & EMS (60.9%), Hazardous Condition (10.0%), and Service Call (9.6%).
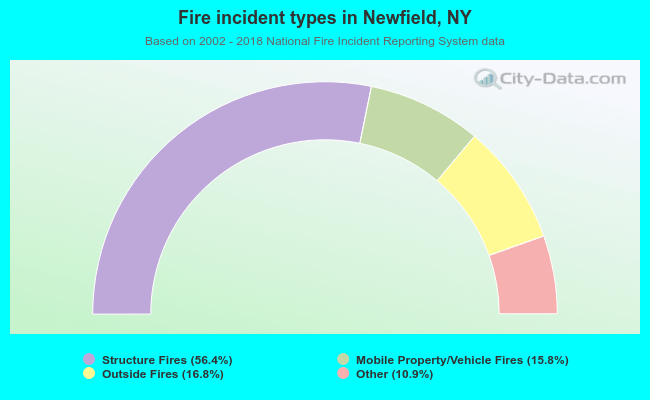 When looking into fire subcategories, the most reports belonged to: Structure Fires (56.4%), and Outside Fires (16.8%).