Newport: Fire Incidents, Delaware (DE)
Where are fire incidents reported in Newport, DE
Something went wrong! Please refresh the page.
|
| |||||||||||||||||||||||||||||||||||||||||||||||||||||||||||||||||||||||||||||||||||||||||||||||||||||||||||||
2002 - 2018 National Fire Incident Reporting System (NFIRS) incidents
- Incident types reported to NFIRS in Newport, DE
- 24432.3%Rescue & EMS
- 19926.3%Fire
- 16321.6%Good Intent Call
- 8010.6%Hazardous Condition
- 324.2%False Alarm
- 314.1%Service Call
- 50.7%Special Incident
- 20.3%Severe Weather
- Fire incident types reported to NFIRS in Newport, DE
- 12763.8%Structure Fires
- 3216.1%Mobile Property/Vehicle Fires
- 2713.6%Outside Fires
- 136.5%Other
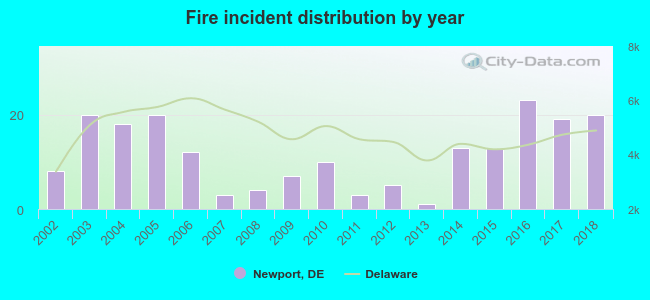 Based on the data from the years 2002 - 2018 the average number of fires per year is 12. The highest number of reported fires - 23 took place in 2016, and the least - 1 in 2013. The data has a rising trend.
 31.2% incidents where reported in the morning and 68.8% in the evening. The most fires (17.1%) took place on Wednesday, and the least (11.1%) on Monday.
 Based on the 199 fires from years 2002 - 2018 most fires (11.1%) took place during October, and the least (5.5%) in September.
 Out of all 756 cases reported during the years 2002 - 2018, the most belonged to the categories: Overpressure Rupture (32.3%), Fire (26.3%), and Service Call (21.6%).
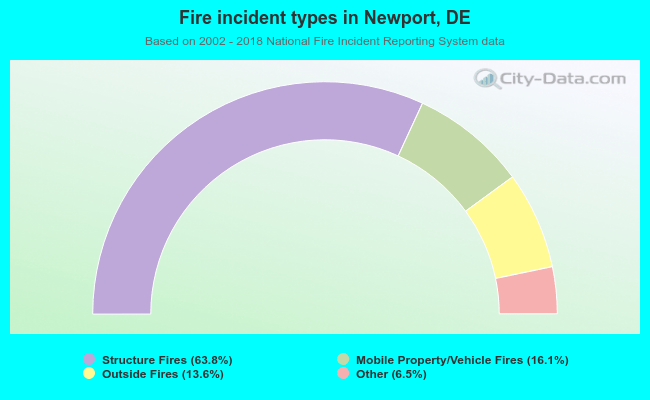 When looking into fire subcategories, the most incidents belonged to: Structure Fires (63.8%), and Mobile Property/Vehicle Fires (16.1%).