| Fire incidents reported |
|---|
| Sreet name | Count |
|---|
| STATESVILLE RD | 52 | | GENERAL THOMAS HWY | 48 | | CYPRESS BRIDGE RD | 28 | | THOMASTON RD | 24 | | BISHOP POQUOSON RD | 20 | | MELONFIELD RD | 18 | | MONROE RD | 16 | | RIDLEY RD | 16 | | OLD CHAPEL RD | 14 | | BLACKHEAD SIGNPOST RD | 12 | | RAILROAD ST | 8 | | SUNBEAM RD | 8 | | BARNES CHURCH CR | 6 | | CROSS KEYS RD | 6 | | EVERETT ST | 6 | | GRAYS SHOP RD | 6 | | MAIN ST | 6 | | MEHERRIN RD | 6 | | WESTBROOK ST | 6 | | BALLPARK RD | 4 | | BARNES CHURCH CIRC | 4 | | BEALE RD | 4 | | CYPRESS BRIDGE ROAD | 4 | | DEPOT ST | 4 | | DRAKE DR | 4 |
| | | Fire incidents reported |
|---|
| Sreet name | Count |
|---|
| DRAKE RD | 4 | | MARY HUNT RD | 4 | | MILL PATH RD | 4 | | ROCHELLE SWAMP RD | 4 | | SUNNYSIDE DR | 4 | | ATLANTIC DR | 2 | | BALL PARK RD | 2 | | BARNES CHURCH CIR | 2 | | BARNES CHURCH RD | 2 | | BISHOP POQUOSON ROAD | 2 | | BISHOP POQUSON ROAD | 2 | | BISHOP PQOUOSON RD | 2 | | BRADSHAW DR | 2 | | CYPRESS SWAMP RD | 2 | | DRAKE DR | 2 | | FULLERS MILL RD | 2 | | GENERAL THOMAS | 2 | | GENERAL THOMAS AND SUNBEAM RD | 2 | | GENERAL THOMAS HIGHWAY | 2 | | GENERAL THOMAS HWY HWY | 2 | | HANDSOM RD | 2 | | HANDSON ROAD | 2 | | MARY HUNT RD. | 2 | | MELON FIELD RD | 2 | | |
|
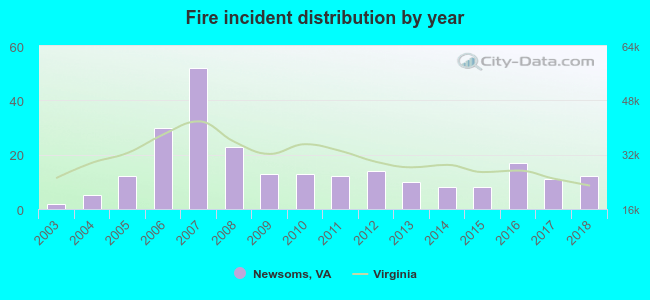 Based on the data from the years 2003 - 2018 the average number of fire incidents per year is 15. The highest number of fire incidents - 52 took place in 2007, and the least - 2 in 2003. The data has a rising trend.
 According to the data from the years 2003 - 2018 the average number of fire-related yearly casualties is 0. The highest number of reported injuries - 2 took place in 2016, and the lowest - 0 in 2003. The data has a constant trend.
 26.0% incidents where reported in the morning and 74.0% in the evening. The most fires (18.6%) took place on Sunday, and the least (10.3%) on Saturday.
 According to the 242 fire incident reports from years 2003 - 2018 most fires (13.2%) took place during August, and the least (5.8%) in May.
 Out of all 922 cases reported during the years 2003 - 2018, the most belonged to the categories: Overpressure Rupture (51.4%), Fire (26.2%), and Rescue & EMS (8.6%).
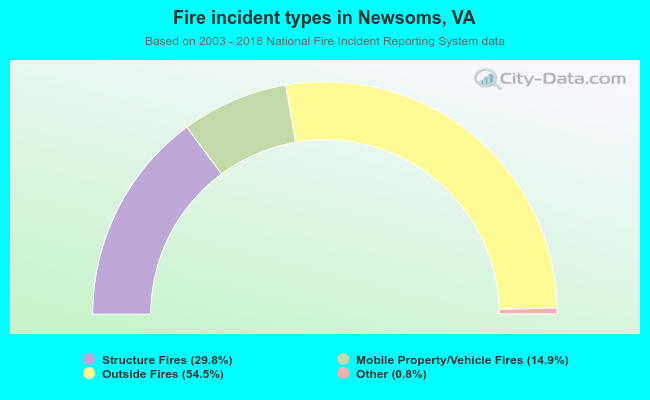 When looking into fire subcategories, the most incidents belonged to: Outside Fires (54.5%), and Structure Fires (29.8%).